

Tax Stability for Energy Dominance

Download a slide deck summary of key takeaways from the report here.
Executive Summary
The U.S. faces an extraordinary energy challenge and opportunity, with rocketing electricity demand growth and increasing extreme weather events straining the grid to levels not seen in decades. American leadership and innovation across all energy sources — including domestically produced wind, solar, geothermal, hydropower, energy storage, hydrogen, advanced nuclear, and other technologies — can meet this challenge while advancing domestic prosperity.
Ninety-five percent of the new generation capacity added to America’s power grid in 2024 came from clean energy resources.1 Their development set unprecedented records across all economic indicators, attracting $115 billion in investment in new clean energy generation, sustaining over 3.5 million jobs, and powering a record 170 million homes in 2024.2,3,4
Longstanding federal energy tax credits have played an instrumental role in creating a stable market environment to stimulate this growth, and recent enhancements to those credits have further bolstered domestic energy. These include production and investment tax credits for energy generation facilities, domestic manufacturing, and critical minerals production, associated bonus credits, and new tax credit monetization options like transferability. Maintaining certainty around the current suite of credits supports the continued buildout of American energy, while:
- Fostering job creation and local economic benefits, with forecasts showing the tax credits generate a 400% (4X) return on investment, with $3.8 trillion in total economic activity that will support 1.2 million jobs per year or 13.7 million job-years from 2025-2035.5
- Strengthening global competitiveness as the U.S. faces competition for primacy in both energy production and energy-intensive sectors like artificial intelligence, cloud computing, and domestic manufacturing.
- Driving affordable power prices, with energy system costs forecast to decline by almost 11% under current tax policies by 2035, compared to eliminating current policies.6
- Meeting growing energy demand faster, cheaper, and more efficiently than alternatives.
- Enhancing power reliability for Americans on a daily basis and outperforming other energy sources in instances of extreme weather.7/8
- Supporting national security by powering American military bases and driving demand for domestic critical mineral supply chains.
- Reshoring manufacturing, with 46 new clean energy manufacturing facilities commissioned across 20 states in 2024 alone and 59 additional projects under construction.9
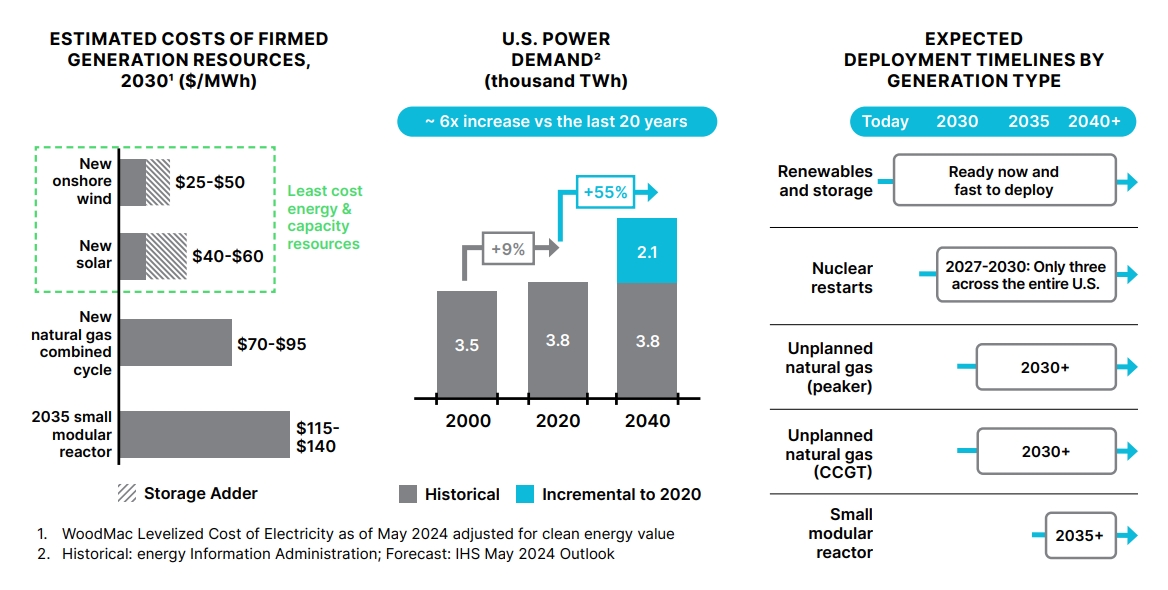
Figure 1. Cost by Resource, Power Demand, and Deployment Timelines by Generation Type, NextEra Energy
Survey Results
To evaluate the potential for clean energy market activity absent significant policy changes, ACORE conducted surveys of clean energy sector investors and developers in December 2024. Survey respondents included top executives from the largest clean energy investors and project sponsors in America, representing over $15 billion in capital investments. Respondents provided information about their investment or development plans under a scenario where the federal tax credits for clean energy are maintained, and also under a scenario where the tax credits are repealed or modified.
The survey results illustrate the massive activity planned in the sector over the next three years, with more than half of the respondents reporting plans to increase their activity by more than 10% compared to 2024 levels, absent changes to the tax credits or other policy interventions (see Figures 2 and 3).
No Changes to Energy Tax Credits Means Massive Investments in 2025
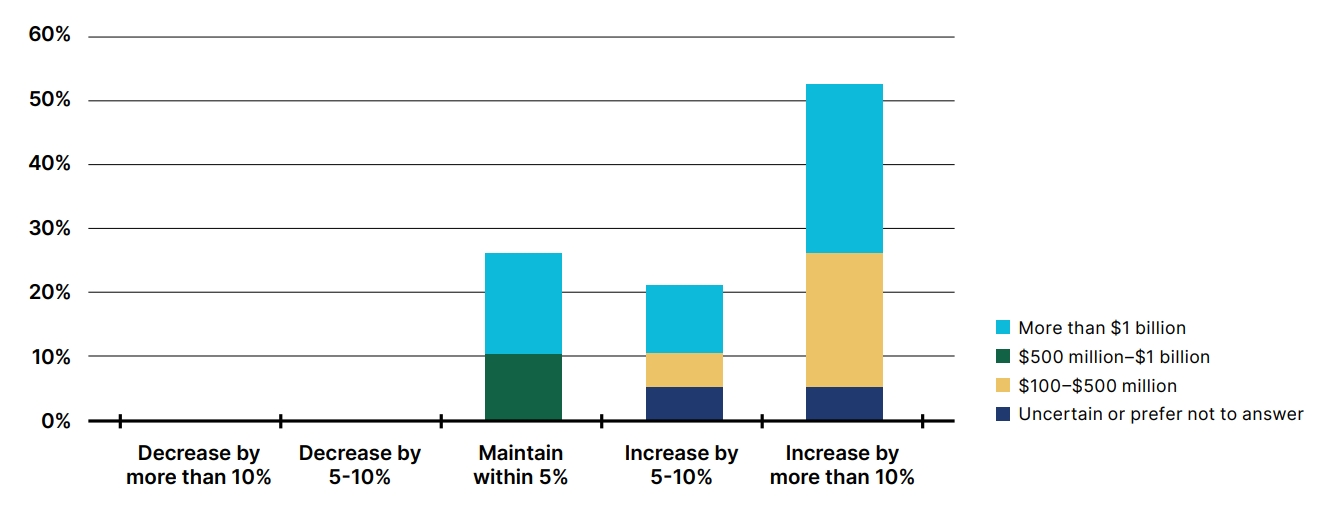
Figure 2. How Investors Plan to Change their Clean Energy Investment in 2025 Compared to 2024, Assuming No Policy Modifications to the Energy Tax Credits, by Annual U.S. Sector Investment
No Changes to Energy Tax Credits Means Massive Energy Deployments in 2025
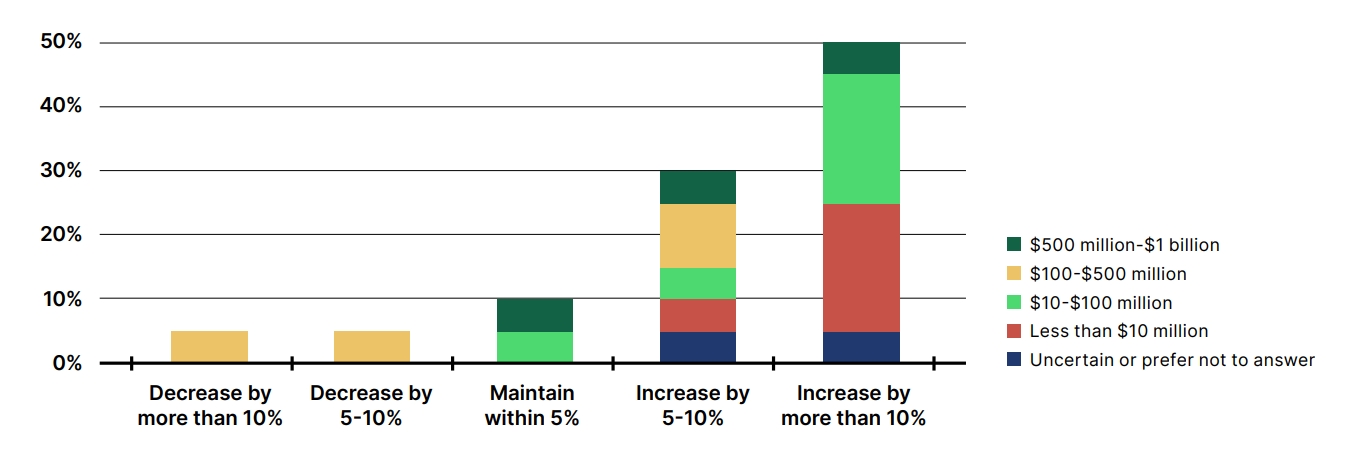
Figure 3. How Developers Plan to Change their Clean Energy Development in 2025 Compared to 2024, Assuming No Change to the Energy Tax Credits, by Total Revenue of U.S. Clean Energy Business
Conversely, tax credit uncertainty could cause 84% of investors and 73% of developers to decrease their activity in clean energy. Among companies with over $1 billion in investments, 80% responded that they would significantly or moderately decrease their clean energy investment plans, potentially translating to the loss of tens of billions of dollars in private sector investment.
Investment Would Decrease with Uncertainty
about the Energy Tax Credits
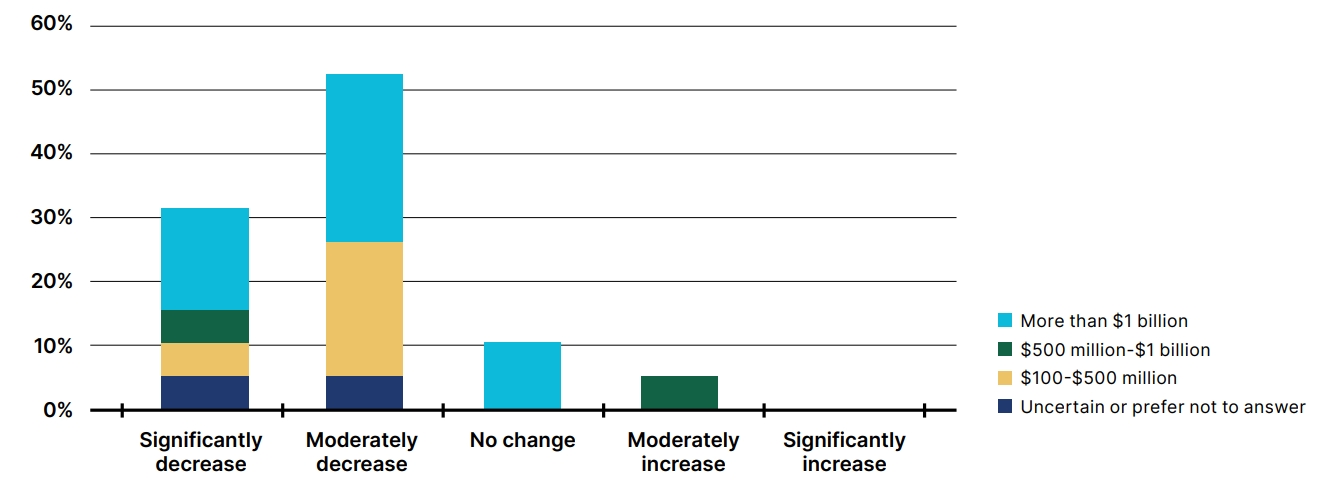
Figure 4. How Investors Anticipate their Clean Energy Investment Plans Would Change with Uncertainty about the Usability of Tax Credits, by Annual U.S. Sector Investment
Furthermore, 58% of investors anticipated the attractiveness of the U.S. market to increase for clean energy investment in comparison to other leading countries over the next three years, assuming no changes are made to the energy tax credits, while only 10% expected U.S. competitiveness to decrease.
U.S. Market Attractiveness Continues to Grow
without Policy Uncertainty around Tax Credits
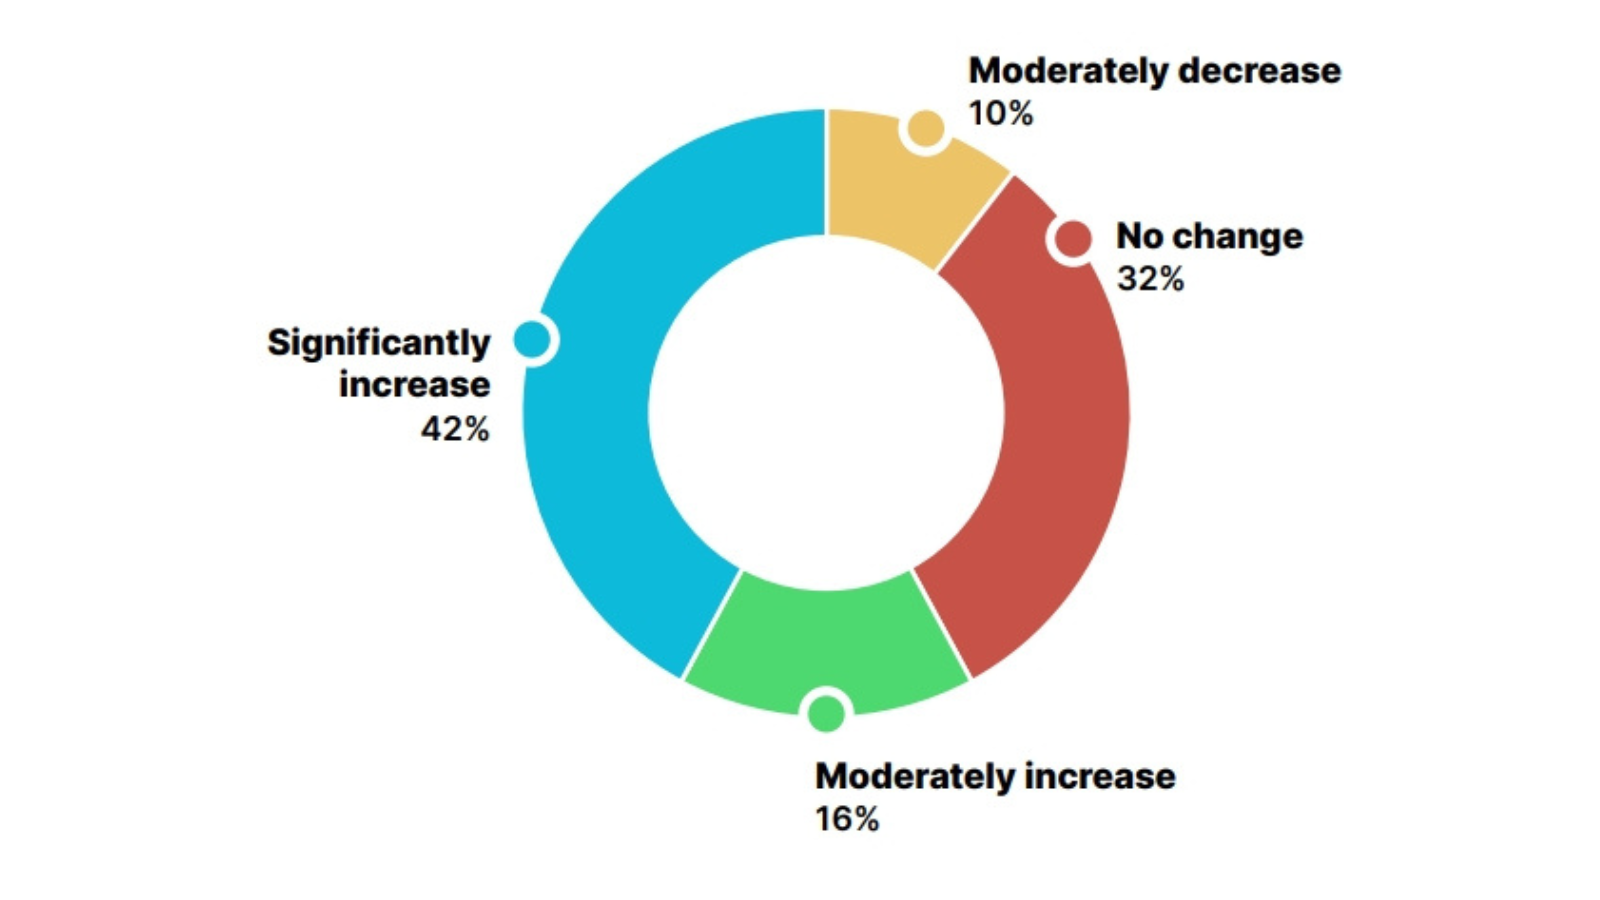
Figure 5. How Investors Expect the Attractiveness of the U.S. Market as a Venue for Clean Energy Investment to Change Compared to Other Leading Countries in 2025-2027, Assuming No Policy Modifications to the Energy Tax Credits
In interviews, both small and large companies stressed the importance of long-term certainty for enabling the success of clean energy projects, and they indicated that tax credit uncertainty could chill billions of dollars in private-sector investments. Tax credit monetization options — tax equity, transferability, and direct pay — allow developers to raise the necessary financing to get steel in the ground. In particular, market participants now see transferability as a leading source of investment in the clean energy sector, supplementing other sources of financing like tax equity through hybrid structures.
Most Developers Expect Transferability to Increase in 2025, Assuming Policy Continuation
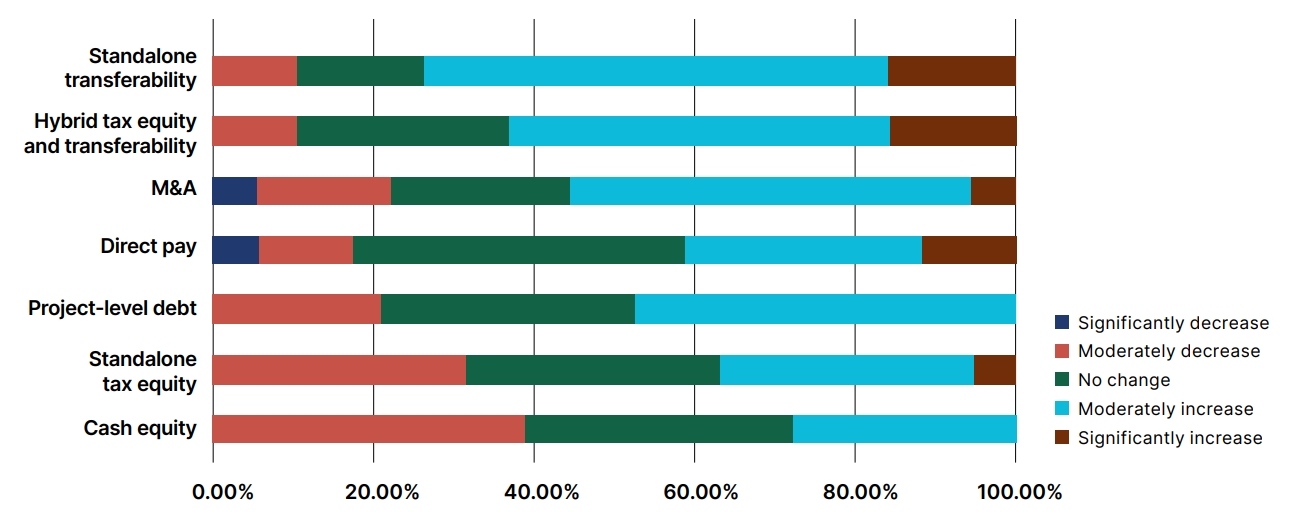
Figure 6. Change in the Availability of Project Finance in 2025 Compared to 2024 for Developers, Assuming No Change to Tax Credits
Recommendations
Based on the survey results and analysis contained throughout this report, the following policy recommendations, if implemented, would achieve universal goals of reducing energy costs, increasing reliability through a diversified and growing electricity generation mix, promoting investment in U.S. manufacturing and energy project development, and enhancing US competitiveness:
- Maintain key energy tax credits: Without energy tax credits, far fewer projects are likely to come online to meet demand growth needs. Maintaining key tax credits will enable the energy sector to add enough capacity to meet demand growth in an affordable manner while spurring innovation in next-generation technologies like enhanced geothermal, advanced nuclear, and carbon capture, utilization, and storage (CCUS).
- Preserve the transferability provision: Transferability has established a simpler process for energy sector financings, allowing companies across the economy to invest in a broad spectrum of generation technologies and domestic manufacturing facilities. Preserving this provision will enable the continued participation of small and medium-sized businesses in the market and propel more projects from ideas on paper to steel in the ground.
- Provide policy certainty: Providing generation and manufacturing projects with certainty for a multi-year window will allow business and innovation to flourish and enhance U.S. leadership in strategic sectors. Giving businesses the rules of the game will help avoid any slowdowns in energy buildout.
State of Play: Energy Tax Credits
Since the oil price shocks of the 1970s, there has been bipartisan support for tax policies that encourage the diversification of our nation’s energy mix, primarily through provisions that help to reduce the upfront costs of capital-intensive energy investments.10
The tax credits discussed in this paper include the following:
- Technology-Neutral Tax Credits (Sections 45Y and 48E): Production and investment tax credits available for wind, solar, hydropower, marine/hydrokinetic, nuclear fission and fusion, and geothermal, along with certain clean combustion and gasification technologies and other innovative clean technologies.11
- Technology-Specific Generation Tax Credits: The Section 45U Nuclear Power Production Credit, Section 45Q CCUS Credit, and Section 45V Clean Hydrogen Production Tax Credit.
- Manufacturing and Advanced Energy Project Credits: The Section 45X Advanced Manufacturing Production Tax Credit, available for the domestic production of clean energy components and critical minerals, and the 48C Qualifying Advanced Energy Project Credit, supporting advanced energy projects and critical minerals projects.
- Bonus Credits: Additional bonus credits available for clean energy projects developed in historically fossil fuel-based communities (energy communities) or low-income communities, or for projects that use domestically manufactured components in the construction of generation projects (domestic content).
Tax Credit Monetization
Developers of clean energy projects often do not have sufficient tax liabilities to efficiently use the tax credits on their own. Tax credit monetization options — tax equity, transferability, and direct pay — allow developers to raise the necessary financing to get steel in the ground. While large clean energy projects have steady and predictable revenues and limited operating costs, they often involve upfront capital costs that require external sources of financing.
Tax Equity
To help raise the necessary capital, clean energy project developers often sell non-controlling, passive interests in their projects to tax equity investors. The tax equity investor receives the tax credits and other tax benefits which they can apply to their own tax liabilities, and the project developer receives the upfront financing required to proceed with development. This structure, shown in Figure 7, allows the tax equity investor to fund a large portion of the project’s capital costs, typically providing between one-third to two-thirds of a project’s funding, with the remainder coming from debt and cash equity.12
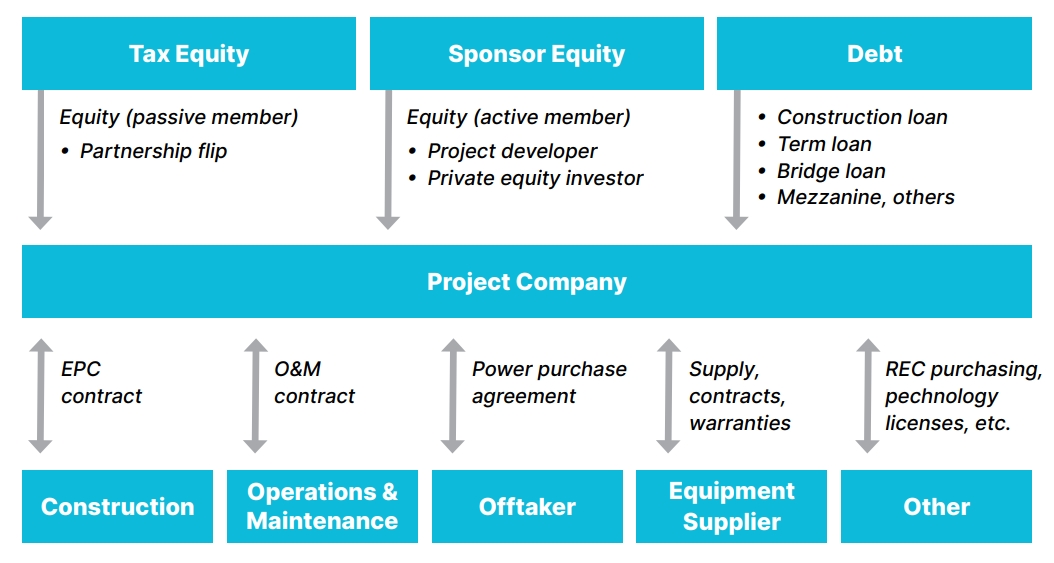
Figure 7. Typical Project Finance Structure
However, while they are attractive investments and still an important piece of the market, traditional tax equity structures are highly complex arrangements. This limits the pool of traditional tax equity investors to banks and other corporations that have the internal resources to manage these investments.
Transferability
Historically, the direct sale of tax credits outside of tax equity structures was not a possible pathway to monetize the tax credits. The Inflation Reduction Act (IRA) established a new transferable tax credit provision (i.e., “transferability”) that simplifies tax credit transactions and makes them available to a much wider pool of investors, including smaller companies. Transferability allows generators of tax credits to transfer the credits to third parties in exchange for cash, as shown in Figure 8.
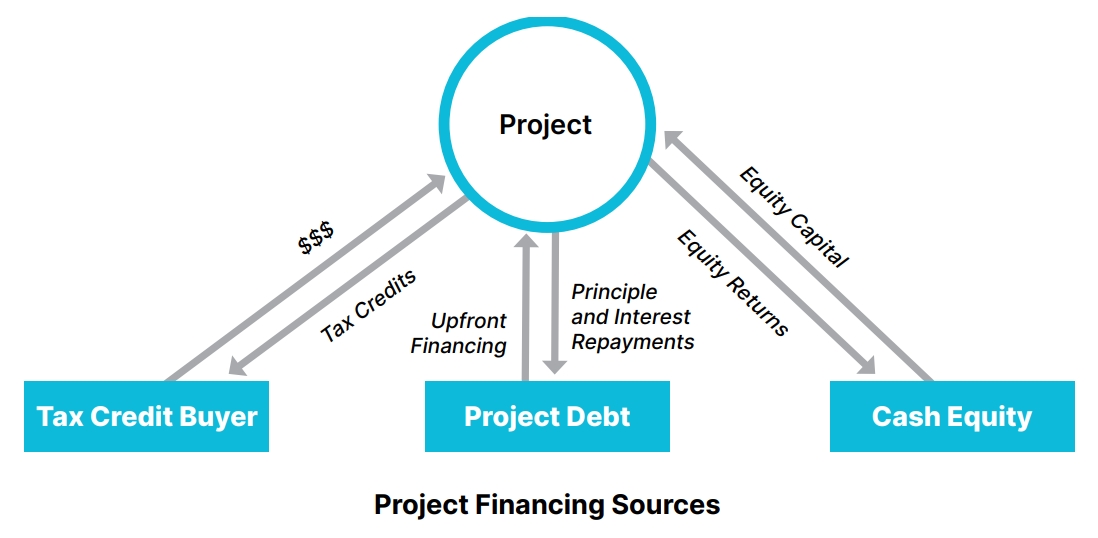
Figure 8. Standalone Transferability Deal Structure
Transferability has already had a transformative impact on the financing of both generation and manufacturing projects.13
Transferability has also been integrated into traditional tax equity structures, where all or a portion of the tax credits under a tax equity partnership are sold to a third-party, which is known as a hybrid structure, as shown in Figure 9.14 Traditional tax equity investors facilitate transferability investments from other buyers, performing due diligence and syndication services that make a greater number of investors comfortable participating in the market. Incorporating hybrid projects into their portfolios allows traditional tax equity investors to deploy their capital more effectively across a broader range of projects while also increasing the volume of financing available for each individual project.
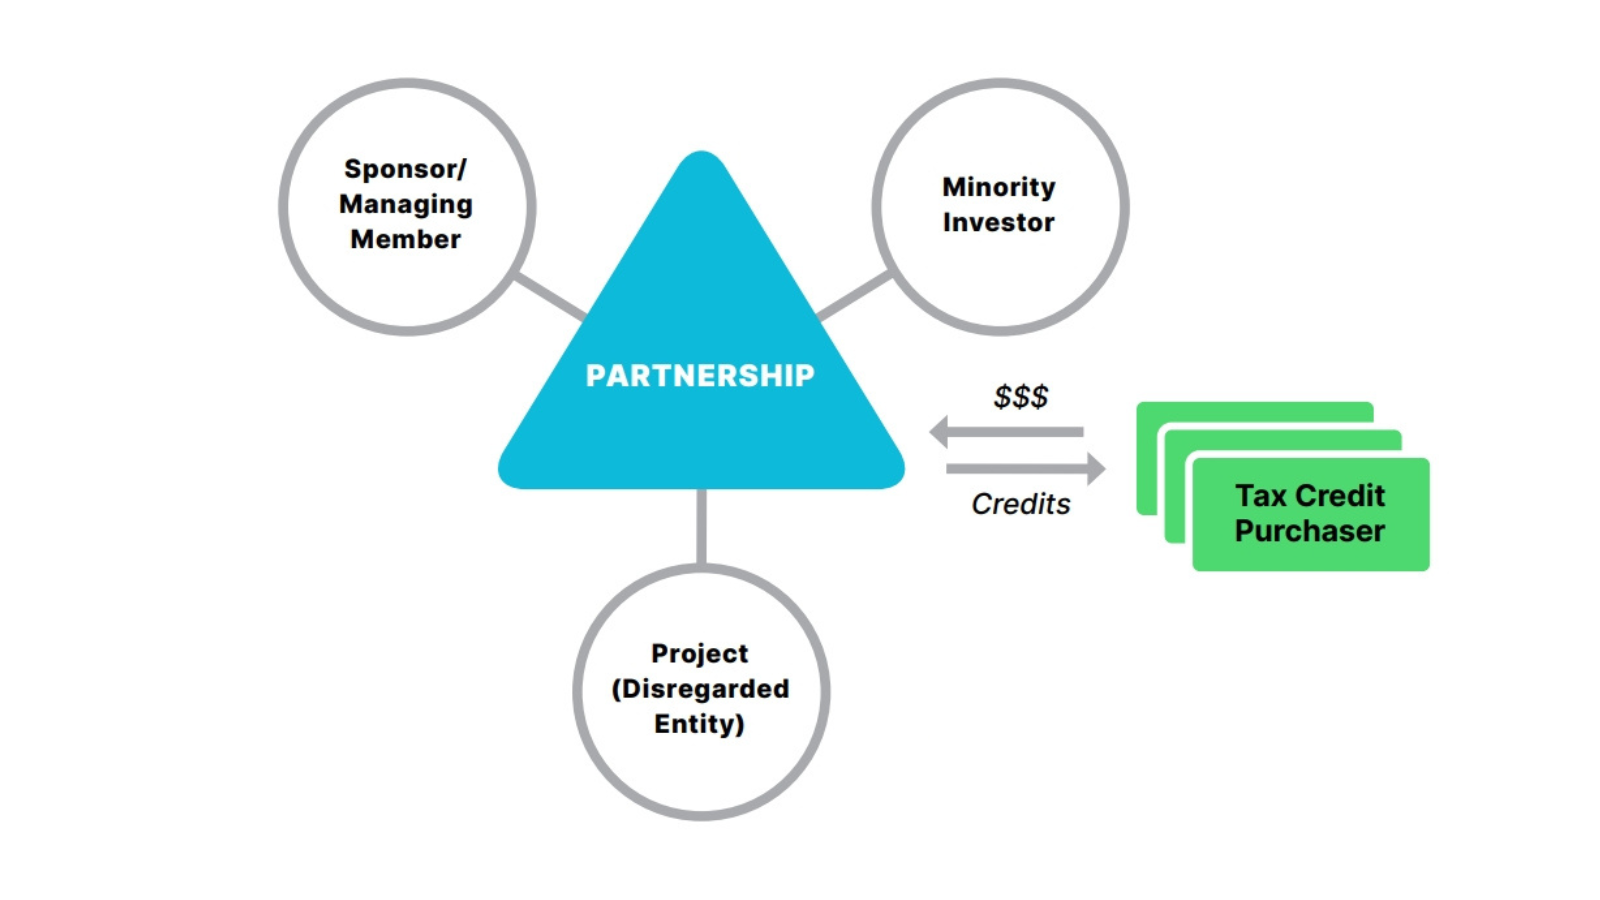
Figure 9. Hybrid Tax Equity-Transferability Project Finance Structure, White & Case
Beyond the banks and corporations that have historically been involved in the traditional tax equity market, transferability has enabled new entrants to participate in the space, allowing more companies and smaller organizations to deploy their capital to advance domestic clean energy. Transfer deals have allowed many small and medium sized businesses to take advantage of the credits, which has enabled their growth, expansion, and job creation.
Transferability has also opened the investment market for emerging technologies and manufacturing projects, which historically have not been financed by traditional tax equity investment. In the second half of 2024, tax credits generated by technologies newly eligible for tax credits under the IRA — such as nuclear energy, standalone storage, geothermal, CCUS, renewable natural gas, and advanced manufacturing projects — made up 72% of the standalone transferability market.15
The findings of the recent market sentiment surveys of clean energy investors and developers, discussed in the last section of this paper, further explore the impacts transferability has had on the market.
Transferability Underpins the American Manufacturing Renaissance and Domestic Energy Dominance
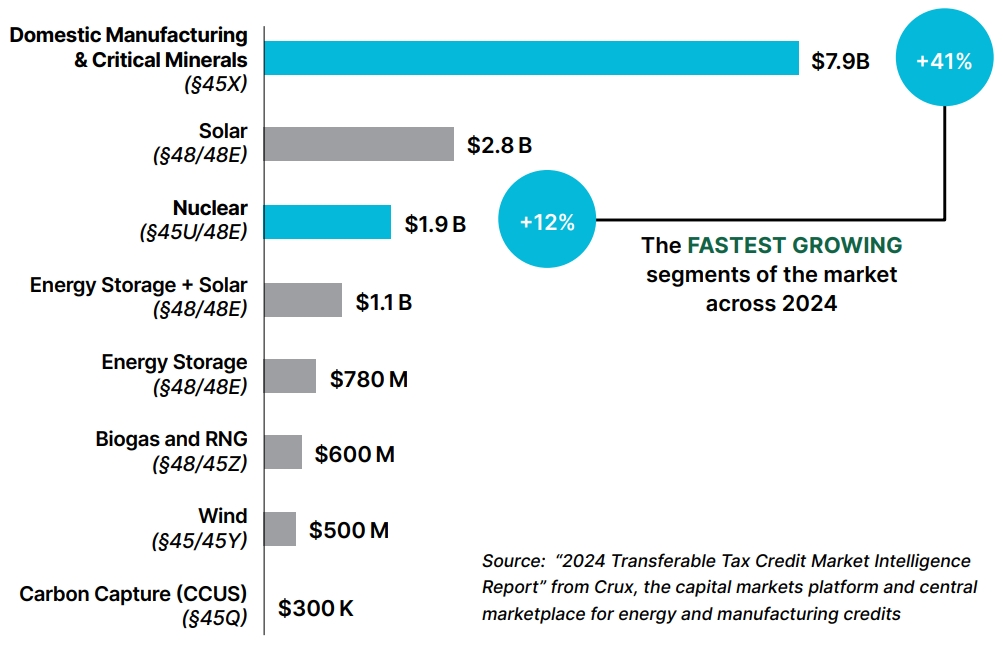
Figure 10. Direct Tax Credit Transfers, July to December 2024, Crux
The BenefitsThe Benefits of Affordable, Reliable, and Clean Energy for the U.S. Economy and
Competitiveness
The energy tax credits outlined in this paper have been instrumental in driving significant levels of deployment and investment in domestic, affordable, reliable, and clean energy. The survey results presented in the last section of this paper show how significantly market participants’ plans could change if the tax credits were repealed or modified. Their continuation promises to contribute to job growth and local economic benefits, bolster U.S. leadership in competitive industries, meet
demand growth needs, enhance grid reliability, benefit national security, reshore manufacturing, and support affordable power prices.
Fostering Job Creation and Local Economic Benefits
Clean energy has created 3.5 million jobs in the U.S., with the potential for significant further job growth in 2025 and beyond.16 From 2023 to 2033, wind turbine service technicians and solar photovoltaic (PV) installers are projected to be the fastest growing occupations in the U.S. by the Bureau of Labor Statistics.17
Over 400,000 jobs associated with clean energy projects have been announced since the enactment of the tax credit extensions in the IRA.18 These jobs are spread across 48 states and Puerto Rico, as shown in Figure 11, with Georgia leading with over 43,000 estimated new jobs. Analysts project that IRA repeal could result in one million fewer net jobs by 2030.19
Clean Energy Jobs per State under Current Policy
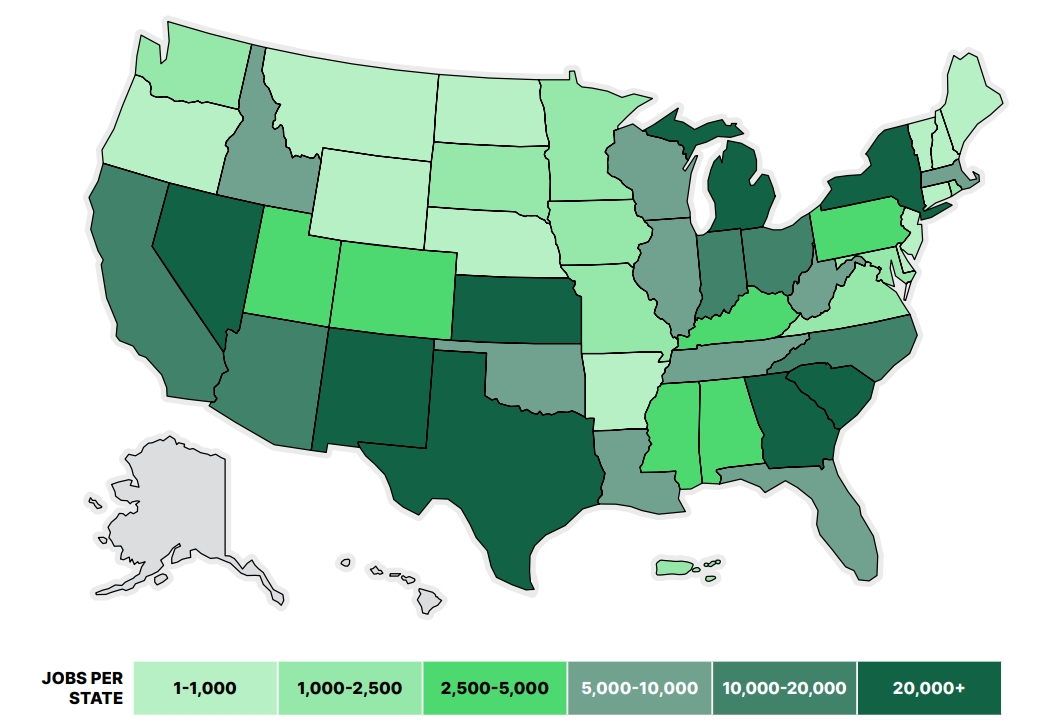
Figure 11. Clean Energy Jobs per State, Climate Power
Beyond job creation, clean energy also brings local economic benefits to communities. For instance, farmers who lease a portion of their land to clean energy developers earn a critical secondary revenue stream. Communities across the country also see increased local tax revenue from generation facilities, as well as other local benefits. One study examining U.S. counties from 1995 to 2018 found that wind energy installations led to meaningful increases in county GDP per capita, income per capita, median household income, and median home values.20 Recent forecasts show that the tax credits will continue to generate a 400% return on investment, with $3.8 trillion in total economic activity that will support 1.2 million jobs per year or 13.7 million job-years from 2025-2035.21
Invenergy’s Samson Solar Energy Center will generate $450 million of local economic investment over the life of the project and provides critical lease payments to local landowners.22
Strengthening Global Competitiveness
Domestically produced wind, solar, geothermal, hydropower, energy storage, hydrogen, advanced nuclear, and other technologies are pivotal to advancing an all-of-the-above energy strategy that expands U.S. international competitiveness. These technologies support a diverse, resilient energy mix and powers critical economic priorities, such as data centers and advanced manufacturing sites.
As a result of its all-of-the-above approach, the U.S. is already the world’s largest producer of oil and natural gas. Clean energy provides domestic, readily deployable energy solutions to meet Americans’ needs while continuing to enable high-value exports of liquefied natural gas and other resources abroad, and further lessening dependence on unpredictable foreign actors and external shocks.
Repealing energy tax credits could shift energy investment away from the U.S. In critical energy sectors, U.S. investment already lags behind China, as shown in Figure 12.23 Recent analysis estimates that a full repeal of the IRA could create up to $80 billion in energy investment opportunities in other countries, compared to a base case scenario where the IRA is preserved. Under these projections, announced projects and 50% of projects under construction could be canceled, and manufacturers would likely seek to meet global demand through factories abroad. Repeal of the IRA could cost the U.S. up to $50 billion in lost exports of solar modules and battery cells alone through the loss of domestic manufacturing.24
U.S. Investment Lags China in Critical Technologies
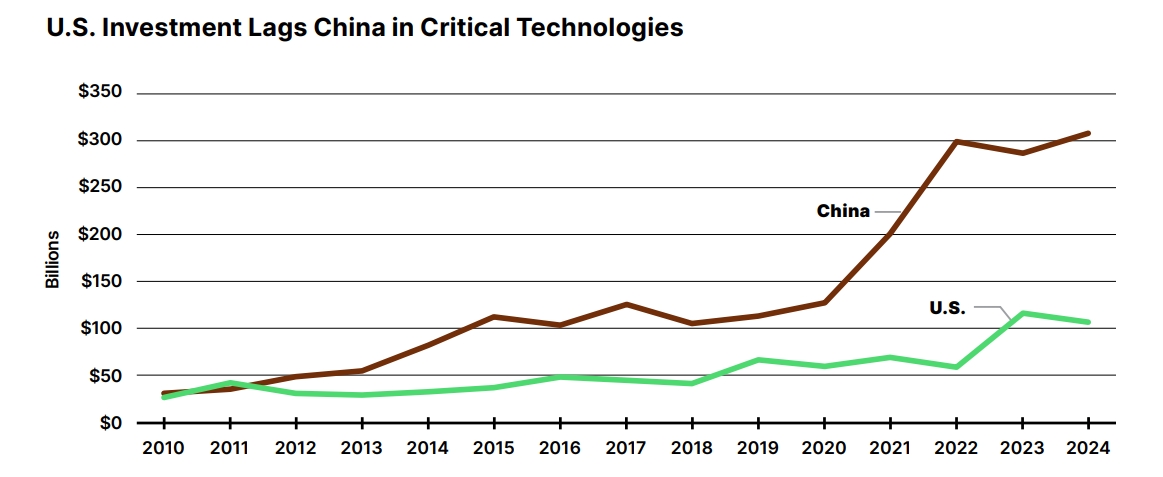
Figure 12. Investment in Solar, Wind, Geothermal, and Energy Storage, U.S. vs. China, BloombergNEF
Meeting Growing Energy Demand
The U.S. is facing growth in electricity demand at levels it has not seen in decades, driven by building and industrial electrification, residential electric use (such as heat pumps), artificial intelligence, cloud computing and data centers, advanced manufacturing, electric vehicles (EVs), and other sources. According to recent findings from the Lawrence Berkeley National Laboratory, data centers alone could triple their energy consumption by 2028 and account for 12% of domestic energy use.25 In total, national electricity demand is projected to increase by 15% or more by 2029.26 In the
decade preceding 2023, grid planners forecasted an average annual growth rate of just 0.5%.27 Ensuring the stability and reliability of the U.S. grid will require a significant amount of new energy resources to be added rapidly.
Electricity Demand Growth Forecasts Are Rapidly Increasing
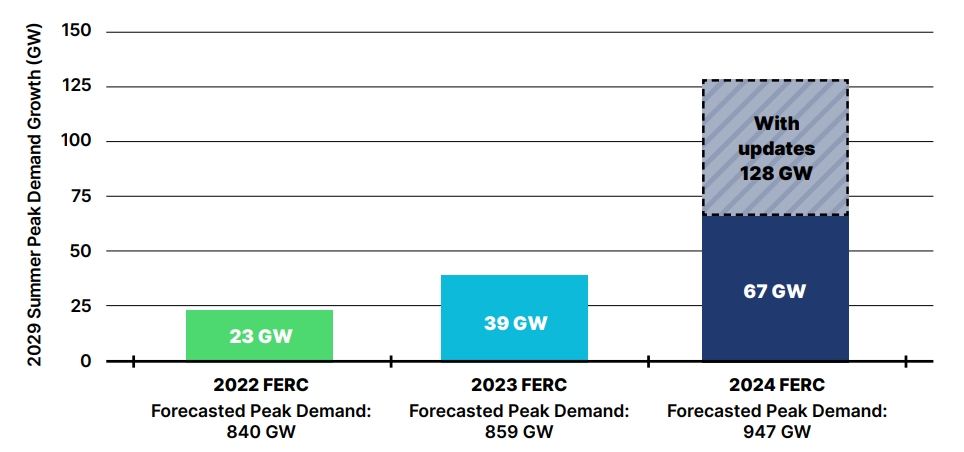
Figure 13. 5-Year Nationwide Growth Forecast, Grid Strategies
The aggregate effect of reversing energy tax policy could mean that an insufficient amount of new power comes online in the necessary time frame, leaving customers more vulnerable to price spikes and blackouts, stranding investments, and undermining the revitalization of U.S. manufacturing and technological leadership. According to a recent study, the repeal of tax credits for wind, solar, and battery storage could lead to 237 GW less clean energy deployed by 2040.28
Deployment Speed
Solar, wind, storage, and other clean energy resources can be deployed quickly to meet this growing demand. New natural gas plants that have not begun construction would likely not be ready to deliver power until 2030, and new nuclear plants are unlikely to enter operations until well into the 2030s.29 Conversely, wind, solar, and storage have the shortest development timelines and can be deployed rapidly over the next few years, as shown in Figure 14. In 2024, 93% of all U.S. capacity additions were from these technologies alone, 30 and they represent over 95% of all energy sources in domestic interconnection queues.31 Over the remainder of the decade, as electricity demand grows, wind, solar, and storage represent the most feasible options for new capacity additions.
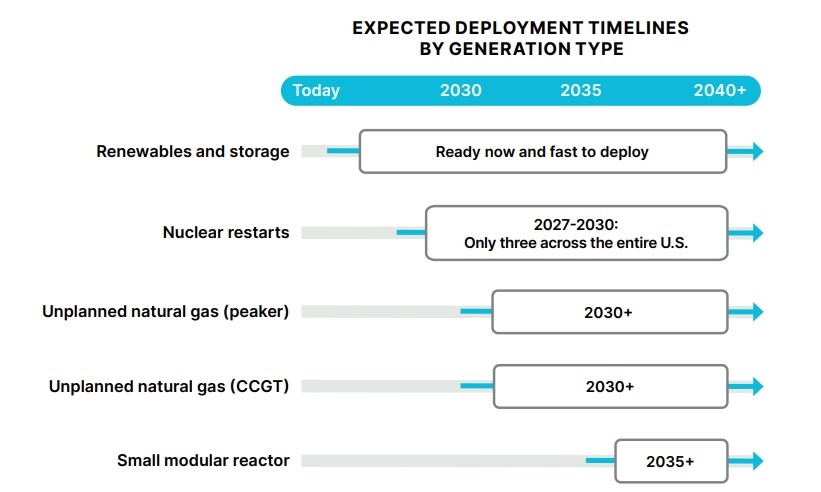
Figure 14. Deployment Timelines by Generation Source, NextEra Energy
Emerging and Innovative Technologies
Tax credits are not only driving increasing deployments of solar and wind — they have also bolstered the development of emerging and innovative energy technologies that can meet growing demand in the coming decades. Two key sectors are next-generation geothermal and advanced nuclear projects, which can provide clean, firm baseload power to power American businesses and homes.32
Global venture capital investment in the geothermal sector totaled $558 million in 2024, almost tripling the 2023 total.33 Conventional geothermal has been around for decades, but geological constraints limit the total potential capacity in the U.S. to roughly 40 GW in specific regions. Advancements in technology vastly increase the feasibly possible capacity of geothermal power to 5,500 GW and allow it to be a nationwide solution for baseload power.34 As next-generation geothermal scales, investors note the importance of policy support, and geothermal developers can leverage the Sections 48E and 45Y technology-neutral credits to help draw
investment.35
Similarly, advanced nuclear drew $1.9 billion in global venture capital in 2024, nearly double the total for 2023. Moving this sector from the lab to the grid will require a series of first-of-a-kind (FOAK) deployments, which are inherently riskier and more expensive. The Section 48E Investment Tax Credit can drive down the cost of a FOAK nuclear project by 26%, empowering first-movers to demonstrate that their technologies have the potential to scale up and achieve economies of scale.36 Beyond advanced nuclear, the technology-neutral credits have already supported nuclear repowerings, with Constellation’s Three Mile Island and Entergy’s Pilgrim unit likely to be eligible for these incentives.37
Enhancing Power Reliability
Relying solely on any one energy source can create risks for consumers and communities. Resource adequacy, operational reliability, and resilience are enhanced when more low-cost generation resources can be utilized, particularly in instances of extreme weather such as winter storms like Elliott in 2022 and the substantial needs driven by extreme heat in the summer of 2023.
In a study published in October 2024, researchers from the University of Tennessee and Trinity College Dublin analyzed over 2,000 blackouts across 378 cities in the U.S. between 2001 and 2020. Their results found no evidence that higher penetration of wind and solar resources increases the frequency or worsens the effects of blackouts. In fact, those grids with higher penetration of wind and solar resources tended to have less frequent and lower-intensity blackouts.38 Beyond solar and wind, other energy resources bolstered by tax credits, such as battery storage, advanced geothermal, and advanced nuclear, can provide the firm baseload power that ensures that consumers have power when they need it.
Clean Energy Represented a Minority of the Capacity Knocked Offline in PJM during Winter Storm Elliott
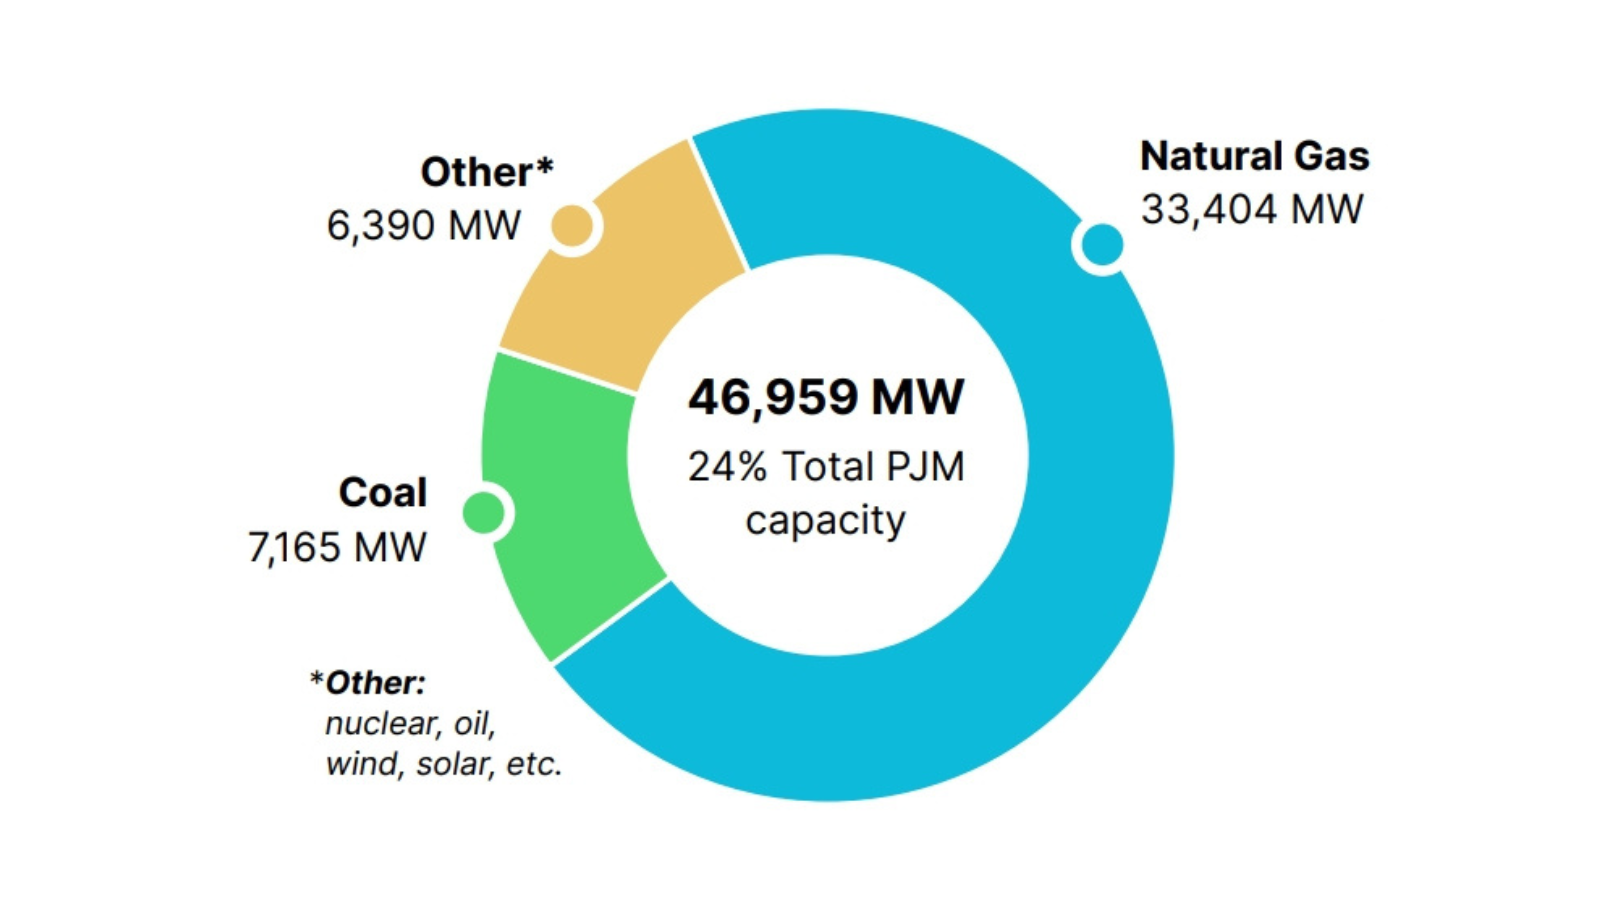
Figure 15. Total Forced Outages in PJM during Winter Storm Elliott, PJM
No resource will perform at its full capacity all of the time, but by adding more cleancenergy to the mix, the grid becomes less dependent on fuel, mitigating any impacts to short- or long-term fuel supply disruption. Thus, the buildout of clean energy is one component of making the bulk power system more resilient and reliable, as the rate of extreme weather events is increasing and putting strain on the grid.39 For instance, during Winter Storm Elliott in December 2022, a quarter of generating capacity in PJM remained offline, with natural gas power plant failures accounting for more than 70% of unplanned outages, as shown in Figure 15.40
Beyond extreme weather events, clean energy plays a stabilizing role for the grid as part of a diverse energy mix, as shown in Figure 16.41 In Texas, the growing fleet of battery energy storage systems (BESS) has provided the critical ancillary services needed to ensure a stable grid frequency and short-term increases in load.42 Under ERCOT market design, ancillary services are procured on the day ahead market and historically were met by natural gas plants. However, the increasing BESS capacity has freed up natural gas plants to participate in the energy markets instead of the ancillary services market, driving more efficient outcomes for consumers. On just two extremely cold days in January 2024, BESS saved ratepayers $750 million in day-ahead market costs, in part through efficient ancillary services and in part through enabling additional gas generation to serve the energy needs associated with spiking demand.43
The significant additions to wind, solar, and storage in California over the past two years have been credited with improving reliability during heat waves. With 11,000 megawatts (MW) of clean energy additions over the past two years, the state was able to avoid any conservation calls or emergency alerts during two weeks of triple digit temperatures in 2024.44 During this time, California exported power, also improving the reliability of the grid of neighboring states.
Clean Energy Technologies Supply the Grid with Critical Reliability Services
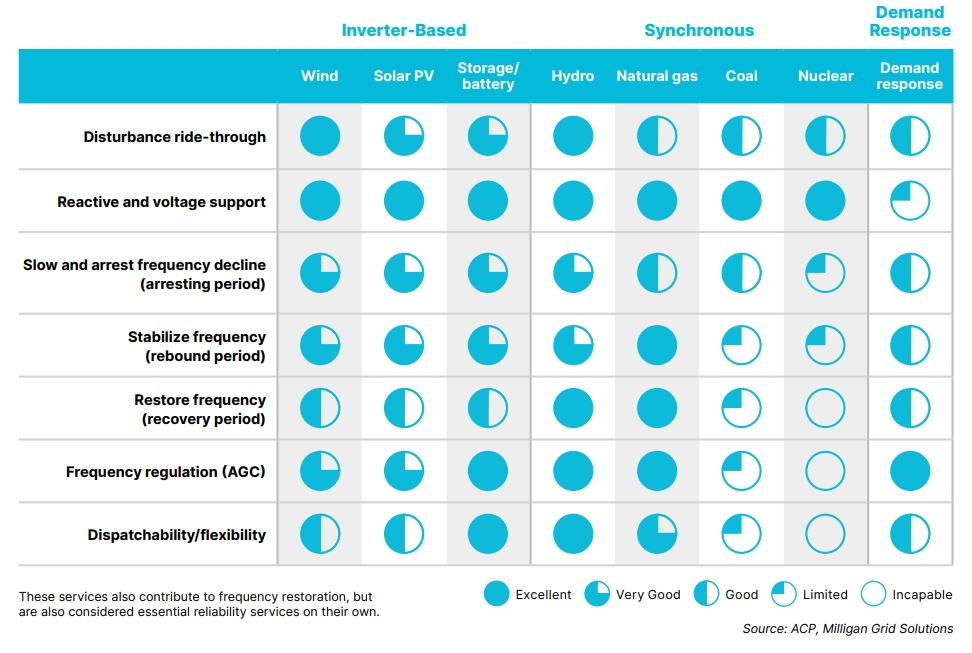
Figure 16. Sources of Grid Reliability Services, ACP and Milligan Grid Solutions
Supporting National Security
Extreme weather, natural disasters, and cyber or physical attacks from adversaries also threaten to interrupt power access to critical military operations. Solar PV panels and wind turbines have characteristics that make them uniquely capable of withstanding many potential threats, and on-base microgrid installations allow military installations to island from the grid.45 These resources have no reliance on the global fuel supply, use inexhaustible fuel sources, and can generate power where it is consumed. This is of particular importance for forward operating bases operating in unstable regions, where fuel convoys can be vulnerable targets for attacks.46 Furthermore, solar PV and wind can be deployed as smaller, decentralized generation sites that are more difficult for adversaries to target, especially with onsite assets that could continue delivering power in the event that a portion of the grid is offline. Over 100 U.S. Army bases have onsite clean energy assets, bolstering American defense.47
Battery storage has also become an important part of military microgrids, allowing the lights to stay on in the event of extreme weather or cyber-attacks. A Department of Defense study found that microgrids incorporating battery storage enhance reliability and energy security, while lowering the costs of operations in comparison to diesel-based microgrids.48
Clean energy also plays a role in extricating supply chain dependence from adversaries. The defense industry relies on critical minerals as inputs for many mission-critical applications, and the People’s Republic of China (PRC) supplies more than 50% of U.S. demand for 24 critical minerals.49 A report from the Select Committee on the Strategic Competition between the United States and the Chinese Communist Party found that the U.S. defense industrial base is not a large enough consumer to fully support a non-PRC critical mineral supply chain.50 Consequently, in order to bolster U.S. national security by developing sufficient capacity in critical minerals, the U.S. needs to continue to nurture and grow consumer sectors — including by expanding clean energy technologies — that will generate the domestic demand and financial support to sustain these developments over the long term. The existing Sections 45X and 48C tax credits incentivize this needed buildout of facilities that process, refine, or recycle critical minerals.
EVelution Energy is developing the first domestic solar-powered cobalt processing facility, in Yuma County, AZ, which will be able to produce an estimated 20-40% of U.S. demand when it becomes operational in 2027.51 Beyond use in EVs, cobalt is a necessary component in key defense and aerospace equipment. The EVelution facility projects expects to benefit from the Section 45X Advanced Manufacturing Production Tax Credit and from the Section 48 Renewable Energy Investment Tax Credit, which it intends to monetize via a transfer agreement.
Reshoring Manufacturing
With the Section 45X Advanced Manufacturing Production Credit, the Section 48C Qualifying Advanced Energy Project Credit, and the Domestic Content Bonus Credit, companies have been incentivized to domestically produce and source critical components of clean energy technologies. This has led to significant investments in emerging sectors across the U.S., as shown in Figure 17. In solar and BESS manufacturing alone, 67 new manufacturing facilities have come online due to federal manufacturing policies, with another 48 under active construction as of December 2024.52 New clean energy manufacturing announced since the passage of the Section 45X Advanced Manufacturing Production Tax Credit has led to at least an additional 20,000 manufacturing jobs.53
Manufacturing Investments Have Grown Significantly since 2022
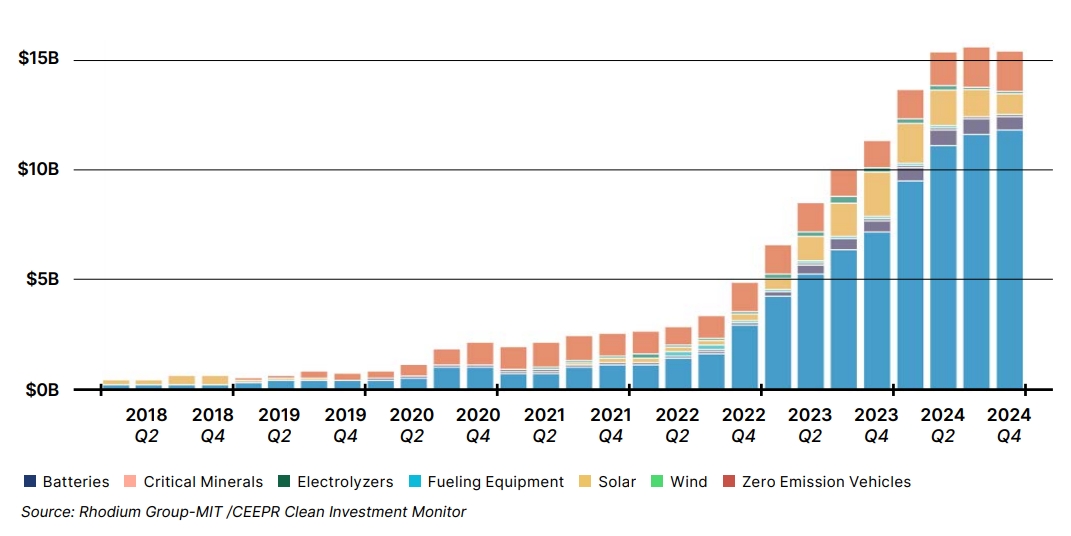
Figure 17. Manufacturing Investments by Clean Technology, Rhodium Group and MIT CEEPR
The reshoring of manufacturing has helped to further American leadership throughout the clean energy supply chain. In February 2025, the U.S. reached 50 GW of solar module manufacturing capacity, enough to meet all domestic demand. These module manufacturing facilities are helping drive demand for domestically produced components up the solar supply chain, as shown in Figure 17.54 Solar cell production returned to the United States in 2024 after this segment of the supply chain had been fully offshored since 2019, and wafer and ingot manufacturers have announced plans for 24 GW and 13 GW of production, respectively.55,56
Solar Module Supply Chain
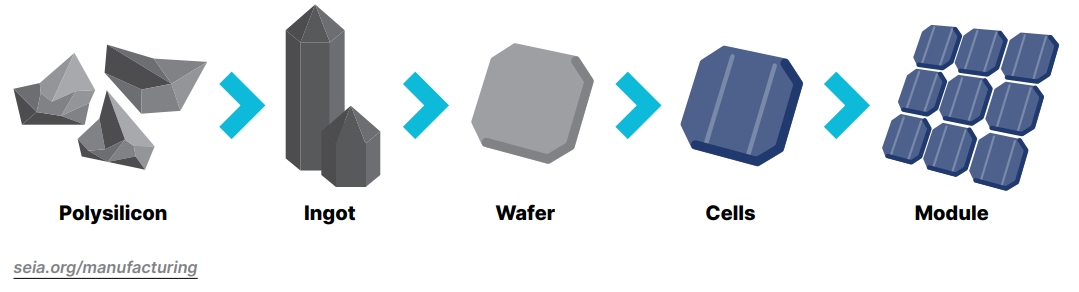
Figure 18. Solar Module Supply Chain, Solar Energy Industries Association
The Section 48C tax credit has been awarded to manufacturing facilities that will produce modules used in advanced nuclear projects and turbines used in conventional nuclear and hydroelectric plants.57 These new clean energy manufacturing projects are spread across the country, with benefits seen by both rural and urban communities, as shown in Figure 19.
At its inverter manufacturing facility in Simpsonville, South Carolina, EPC Power monetized the Section 45X credits it earned via a tax credit transfer agreement. With more capital available, EPC Power announced plans to more than double its local workforce.58
Energy Manufacturing Facilities Are Coming Online in Districts across the U.S.
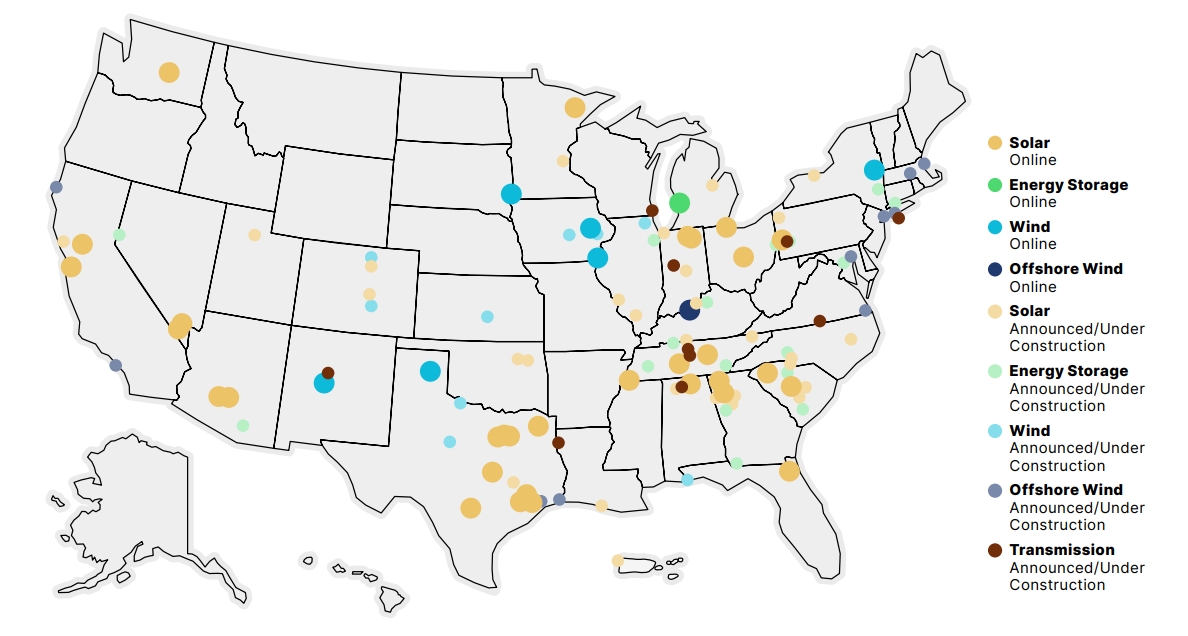
Figure 19. Online and Announced Manufacturing Projects since August 2022, American Clean Power
Driving Affordable Power Prices
Clean energy complements other energy resources to make lower power prices a reality for Americans. New solar and onshore wind are, on average, the two cheapest sources of new electricity on a levelized cost of electricity (LCOE) basis, as shown in Figure 20.59
Solar and Onshore Wind Have Become the Cheapest Sources of New Electricity
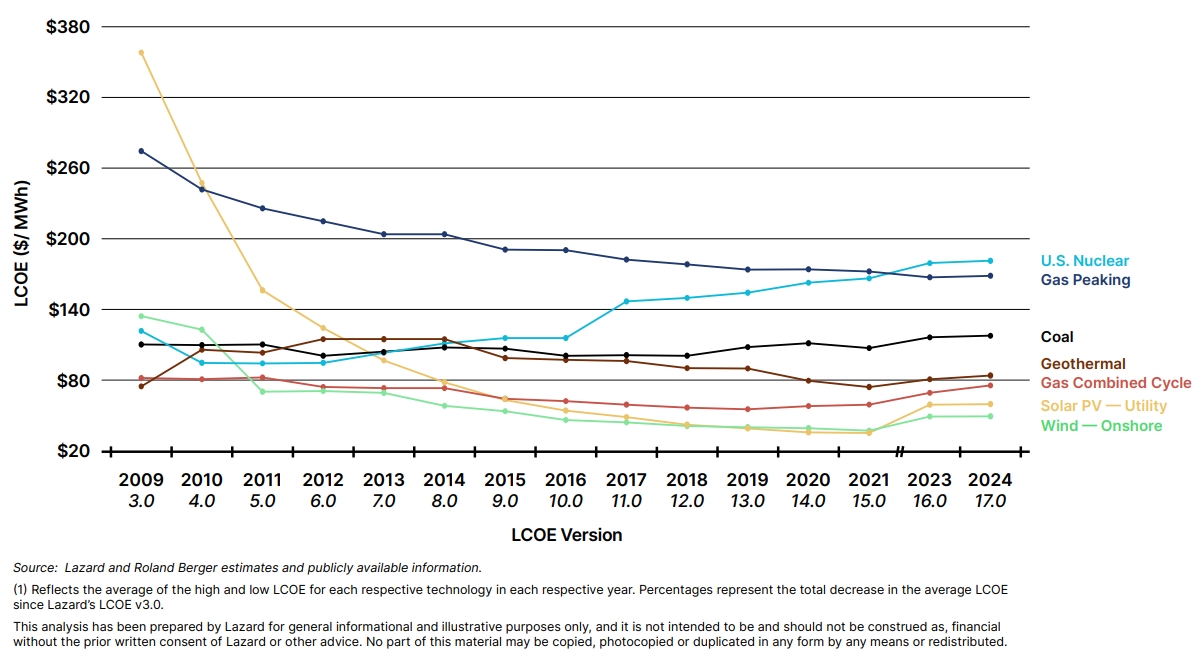
Figure 20. Levelized Cost of Electricity, 2009 to 2024, Lazard
These reductions in cost are bearing out for consumers. A report from July 2024 found that increasing clean energy deployments from solar, wind, and energy storage are not responsible for rising electricity rates, and, furthermore, consumers in states with the greatest share of clean energy resources have been insulated from the biggest impacts. Many of the states with the highest growth in solar and wind generation since 2010 have seen their rates rise slower than inflation, as shown in Figure 21.60
Many States Adding the Most Clean Energy See Rate Increases below Inflation
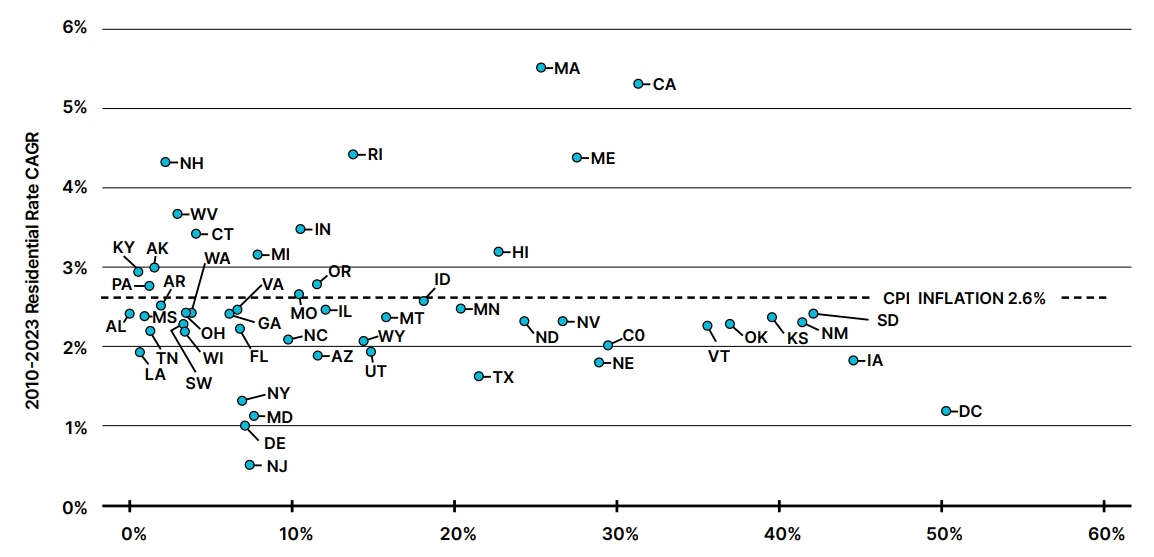
Figure 21. Wind and Solar Growth vs. Residential Rate Increase: 2010 to 2023, Energy Innovation
In wholesale power markets, resources such as solar, wind, and battery storage help compete electricity prices down, as the marginal clearing price that is paid to every generator is based on the bid price of the most expensive generator needed for a given period. As the marginal costs of clean energy sources such as solar, wind, battery storage, hydropower, and geothermal are close to zero, more expensive generators are not needed as frequently when these resources are providing power, leading to savings for consumers. In 2024, average wholesale electricity prices in the Lower 48 states were lower than in 2023 and significantly less volatile than they had been over the last few years, due in part to increases of lower-cost clean energy sources and battery storage.61
The suite of energy tax credits is a central part of lowering power prices for consumers. Energy system costs are forecast to decline by almost 11% under current tax policies by 2035.62 Removal of tax credits for wind, solar, and battery deployments could increase residential electricity bills by 10% on average by 2040.63 In New York and Texas, this would translate to an additional $39 and $29 per month, respectively.64
Evergrow recently financed the tax credits for a rooftop solar array for Bramble Farm, a poultry farm in Moorefield, West Virginia. Rooftop solar now offsets nearly 100% of the farm’s energy consumption, and Bramble Farm saw a 20% savings in electricity costs. Project financing depended on transferability of Investment Tax Credits (ITCs). Skyview Ventures, the project’s owner-operator, earned $457,584 in ITCs—40% of the project’s construction costs. Evergrow provided end-to-end diligence and sale of the credits, which gave Skyview a cash return to help get the project off the ground. Bramble Farm is located in West Virginia’s 2nd Congressional District (R-Moore) and within a federally recognized “energy community” that gave the project an additional 10% adder to its ITC value.
2024 Survey Results2024 Survey Results
Introduction
In December 2024, ACORE surveyed the opinions of senior professionals representing companies that actively finance or develop clean energy projects. The surveys assess respondents’ experiences in the market over the past year and their expectations for project finance and development over the next three years. To evaluate the potential of clean energy market activity absent significant policy changes, the surveys requested respondents to provide information about their 2025 plans under a scenario where the federal tax credits for clean energy are maintained, and also under a scenario where the tax credits are repealed or modified.
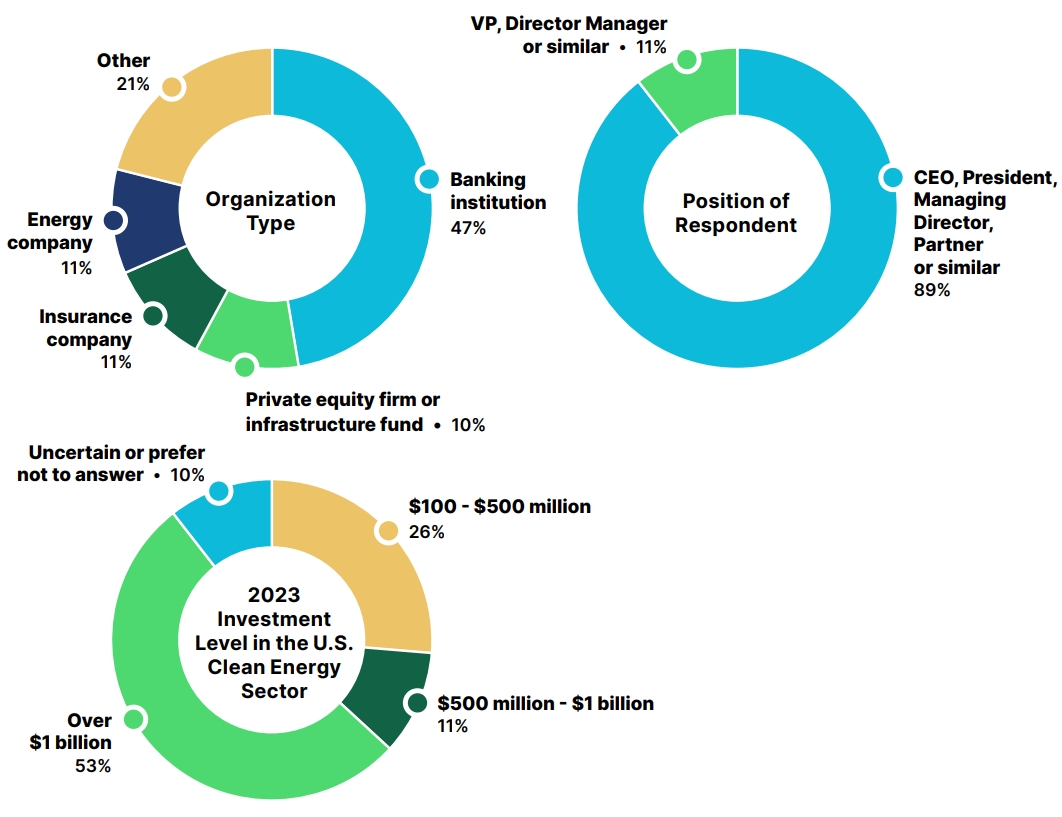
The responses outlined in this section reflect the perspectives of 39 companies. ACORE also conducted interviews with survey respondents, with quotes included on an anonymized basis. A complete profile of survey respondents appears in the Appendix.
- Ninety-five percent of investors surveyed invested or advised on $100 million or more annually in the U.S. clean energy sector;
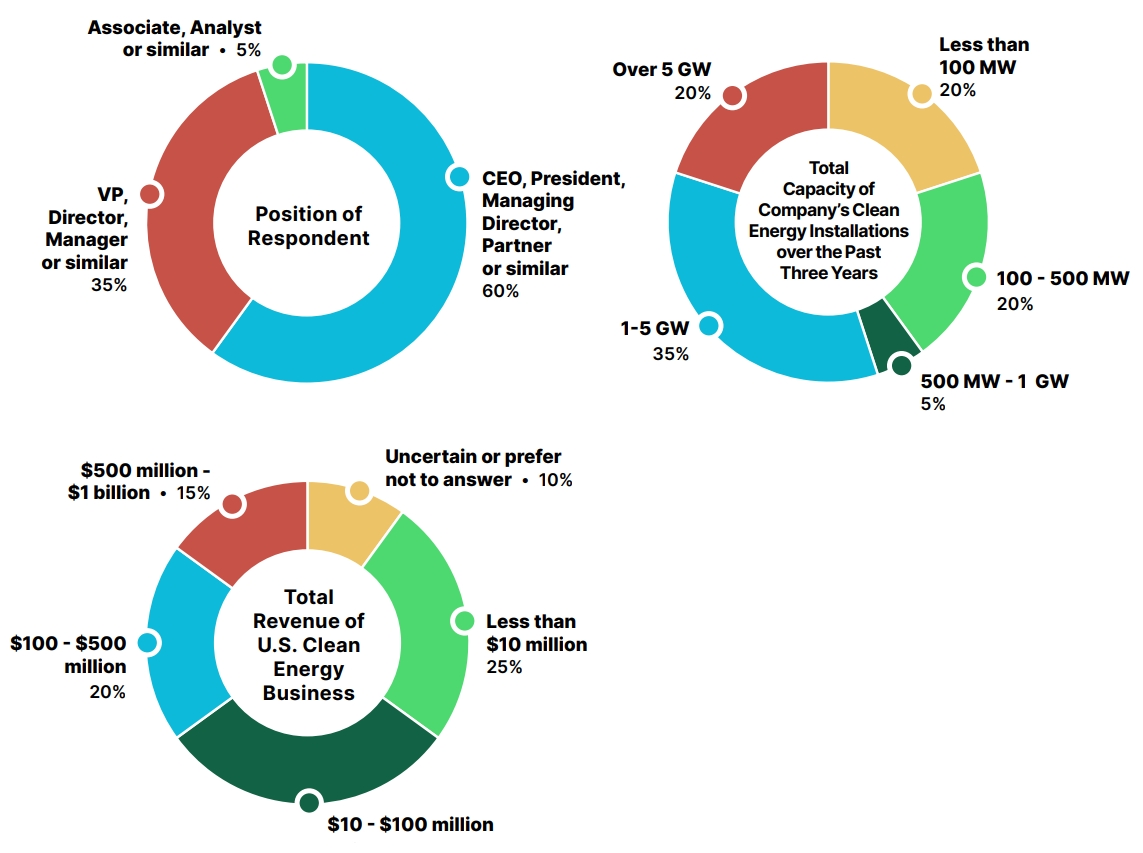
- Eighty percent of developers developed at least 100 MW of clean energy capacity over the past three years; and
- The majority of respondents occupy a senior role at their companies as a CEO, President, Managing Director, Partner, or similar title.
The survey results illustrate how clean energy investors and developers would continue significantly accelerating activity in the sector over the next three years, with more than half of the respondents reporting plans to increase their activity by more than 10% compared to 2024 levels, absent changes to the tax credits or other policy interventions.65 Respondents remained concerned about existing market risks, such as insufficient transmission capacity, delays and costs associated with interconnection queues, inflation and input costs, and supply chain constraints. However, the majority of respondents would continue to see clean energy as an attractive asset class and would not reduce their risk profiles in an environment with limited policy changes. Most respondents also expected a variety of project financing sources to increase, in particular standalone transferability and hybrid tax equity and transferability structures.
However, policy changes that repeal or devalue the energy tax credits significantly threaten to significantly reduce sector investments, along with continued regulatory changes and the implementation of additional tariffs affecting the clean energy supply chain.
Market Outlook and Risk Profile
The survey findings show that with no changes to the energy tax credits, all investors and 90% of developers would plan to increase or maintain their U.S. clean energy sector activity in 2025 compared to 2024. Notably, 50% of the companies that invest $500 million or more annually would intend to increase their investment by 10% or more, translating to billions of dollars in private-sector investments.
As momentum in the sector increases, investors are increasingly comfortable with wind, solar, and battery projects, while emerging technologies like enhanced geothermal and advanced nuclear show great potential for future activity.
No Changes to Energy Tax Credits Means Massive Investments in 2025
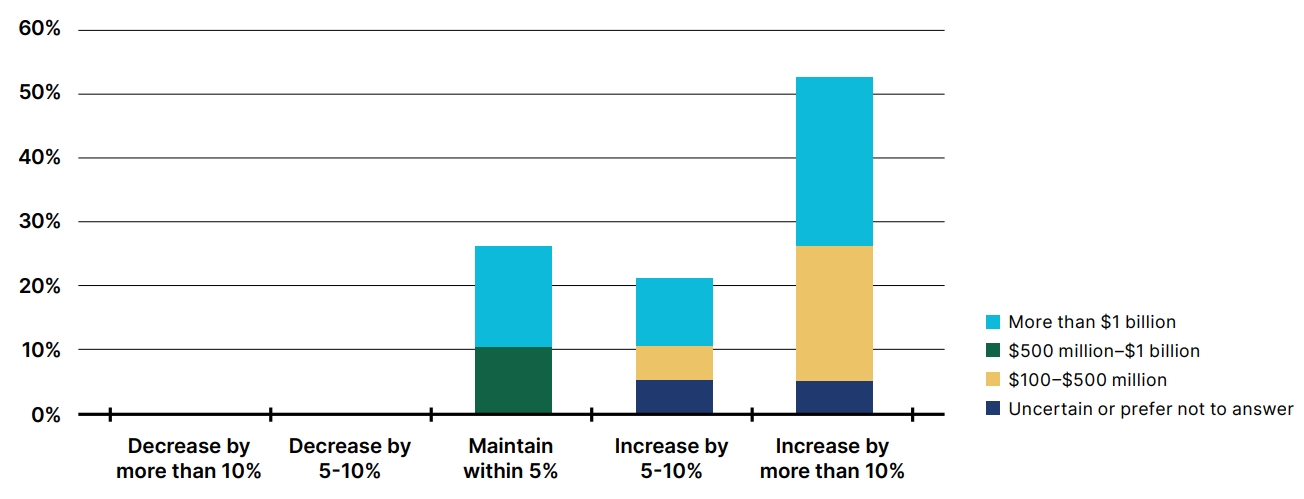
Figure 22. How Investors Plan to Change their Clean Energy Investment in 2025 Compared to 2024, Assuming No Policy Modifications to the Energy Tax Credits, by Annual U.S. Sector Investment
No Changes to Energy Tax Credits Means Massive Energy Deployments in 2025
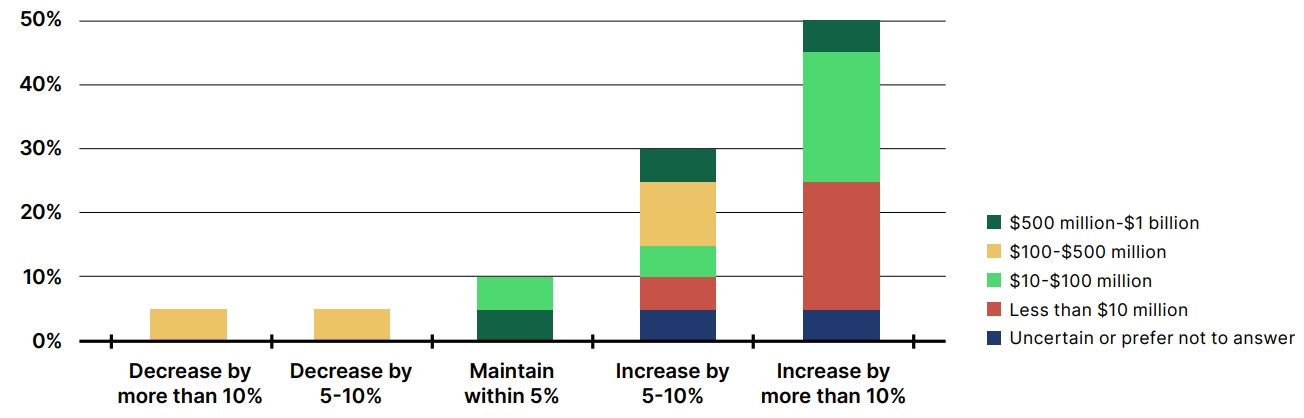
Figure 23. How Developers Plan to Change their Clean Energy Development in 2025 Compared to 2024, Assuming No Change to the Energy Tax Credits, by Total Revenue of U.S. Clean Energy Business
These results are particularly true for small developers. Among those developers with less than $100 million in U.S. clean energy revenues, 91% would plan to increase their development activity by at least 5%, if current tax credit policies remain in place.
Small Developers Plan to Develop More Than Ever under Current Policies
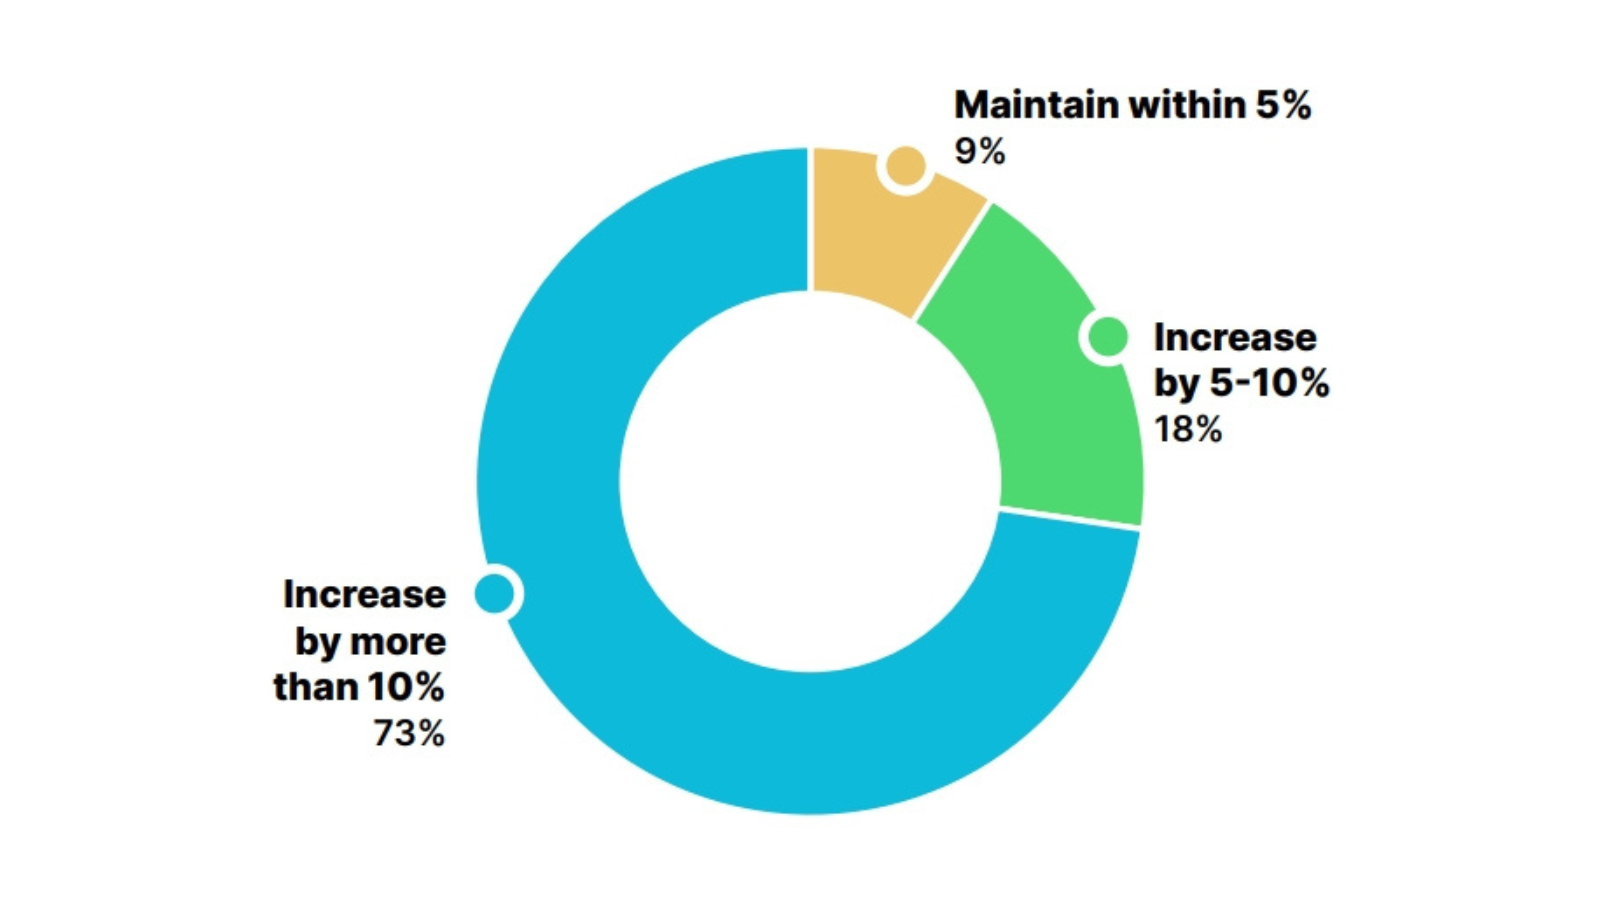
Figure 24. How Developers with Revenues under $100 Million Plan to Change their Clean Energy Development in 2025 Compared to 2024, Assuming No Change to the Energy Tax Credits, by Total Revenue of U.S. Clean Energy Business
As domestic clean energy manufacturing continues to scale, investors would also plan to continue to invest in projects generating Section 45X Advanced Manufacturing Production Tax Credits. Over the next three years, 56% of surveyed investors planned to invest in projects earning these credits if policies are not changed.
Domestic Manufacturing Continues
to Attract Many Investors
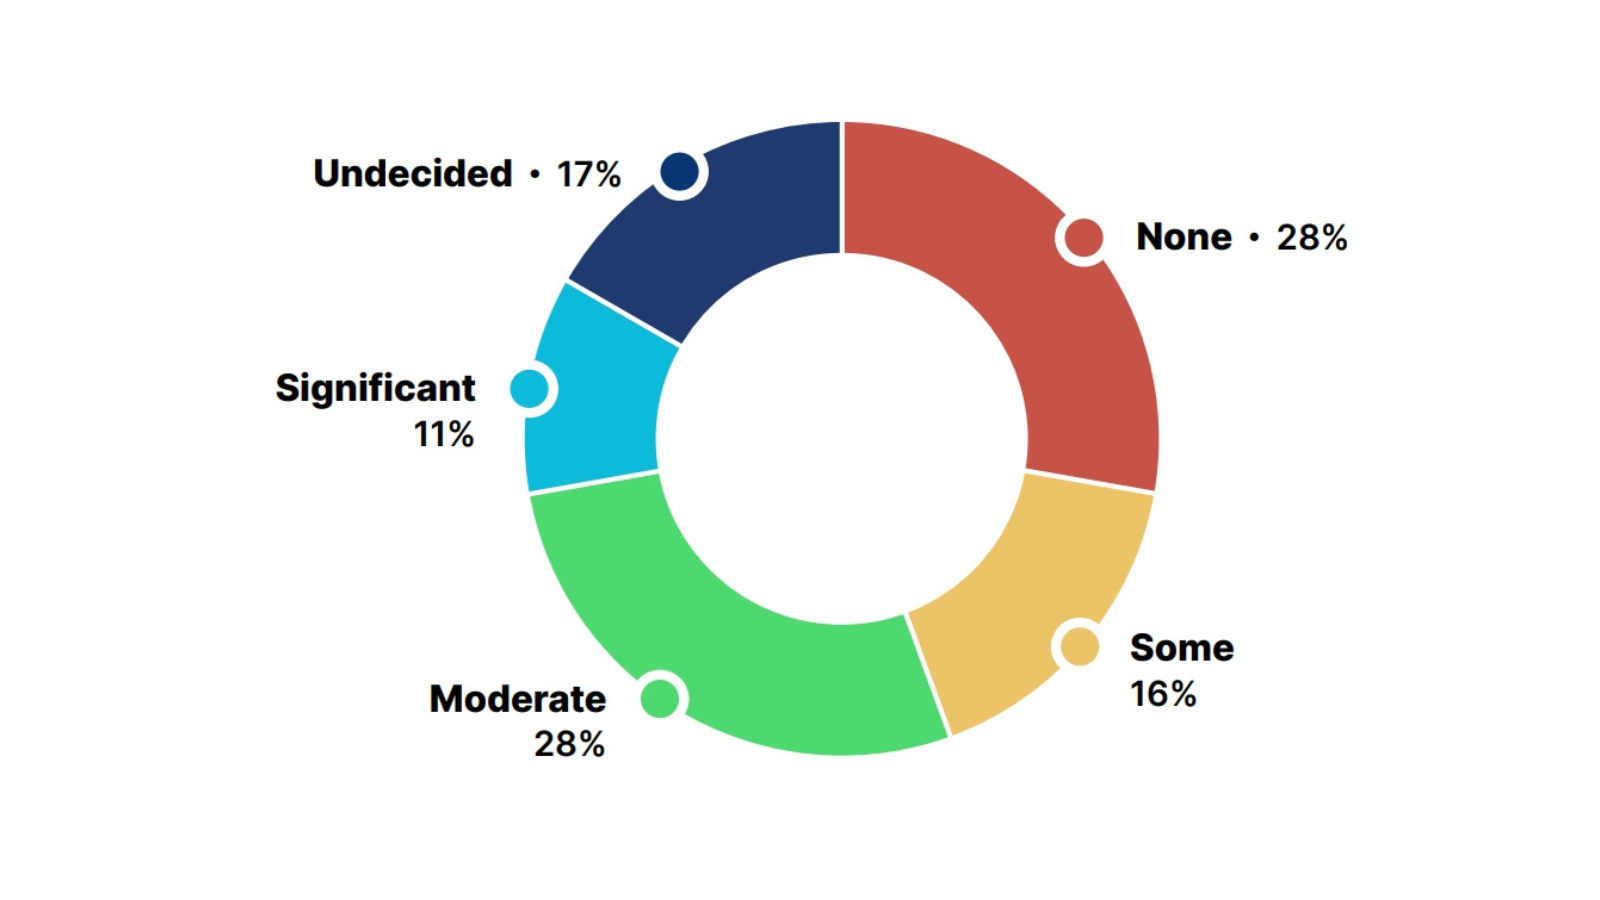
Figure 25. Investors’ Planned Investment Level in Projects Earning 45X Manufacturing Credits, 2025-2027
Furthermore, 58% of investors anticipated the attractiveness of the U.S. market to increase for clean energy investment in comparison to other leading countries over the next three years, assuming no changes are made to the energy tax credits, while only 10% expected U.S. competitiveness to decrease. Compared to other asset classes in their portfolios, 47% of investors expected clean energy investment to increase in attractiveness over the next three years, while only 11% expected it to moderately decrease.
U.S. Market Attractiveness Continues to Grow without Policy Uncertainty around Tax Credits
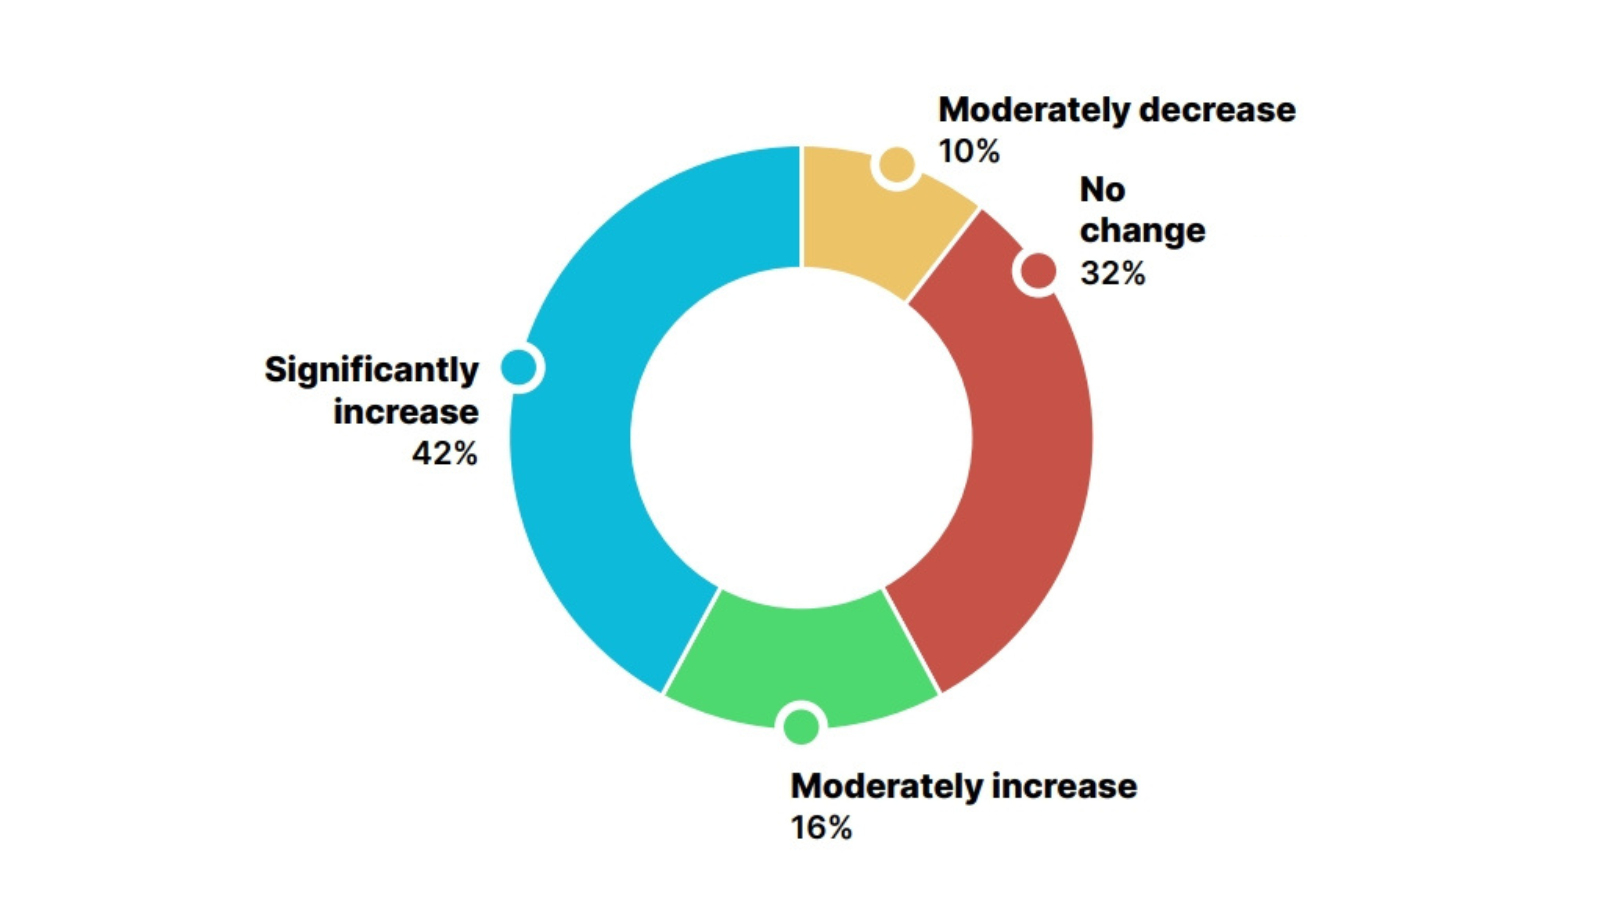
Figure 26. How Investors Expect the Attractiveness of the U.S. Market as a Venue for Clean Energy Investment to Change Compared to Other Leading Countries in 2025-2027, Assuming No Policy Modifications to the Energy Tax Credits
Clean Energy Remains an Attractive Asset Class to Investors
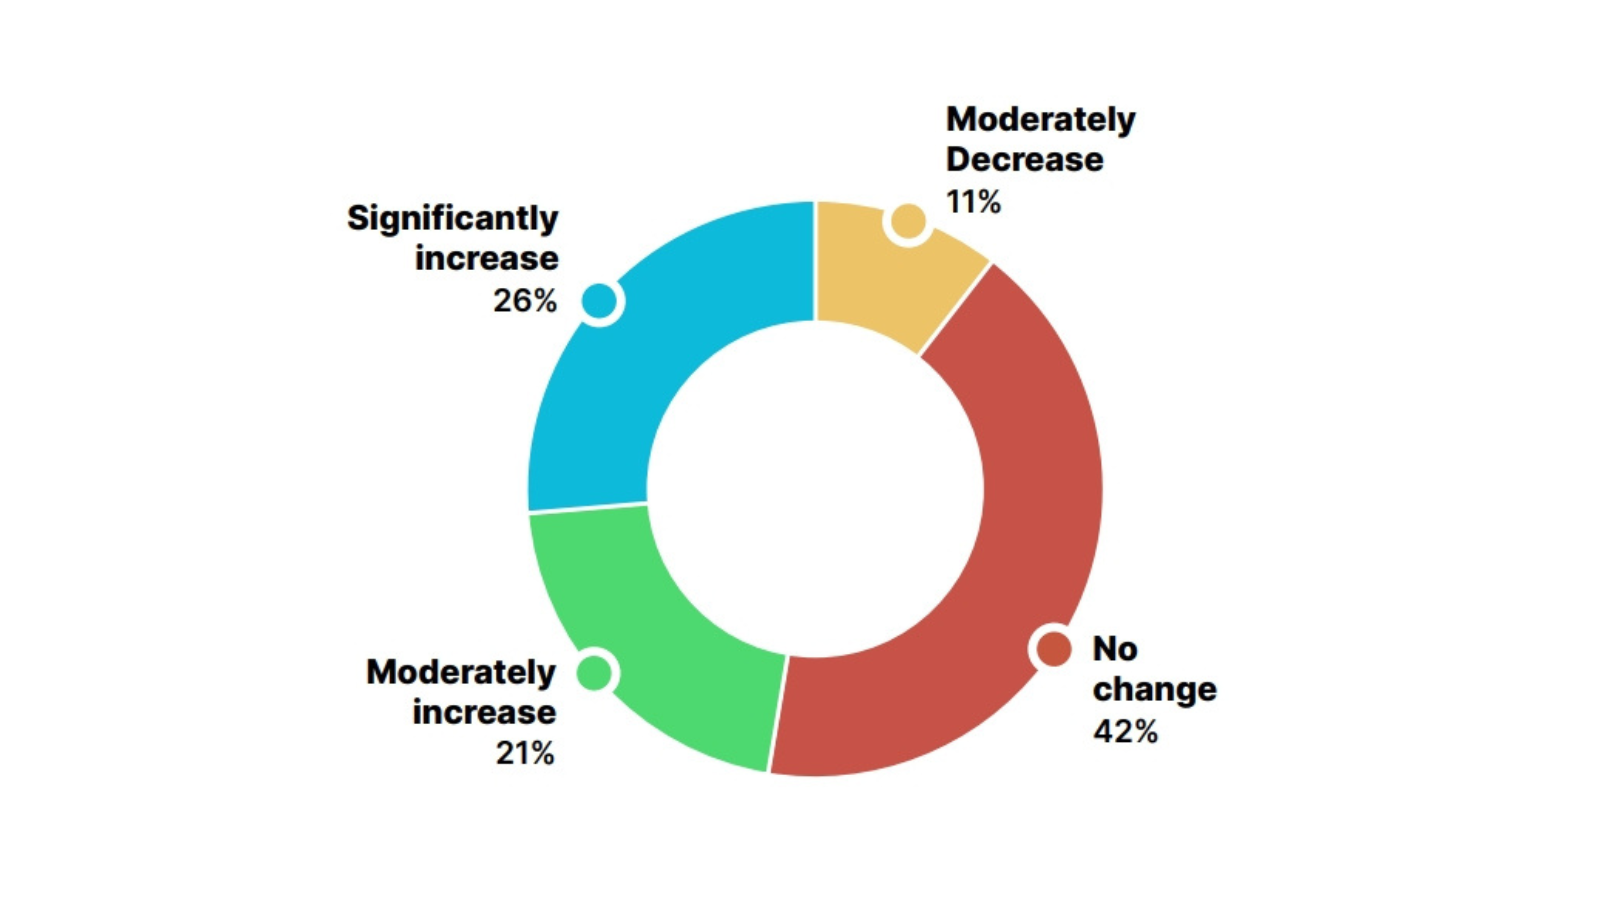
Figure 27. How Investors Expect the Attractiveness of Clean Energy to Change in Comparison to Other Asset Classes in their Investment Portfolios in 2025-2027, Assuming No Policy Modifications to the Energy Tax Credits
Beyond changes to the energy tax credits, developers and investors face a host of other market risks to their portfolios. Both developers and investors agreed on the biggest risks, with insufficient transmission capability and interconnection queue delays and costs topping the concerns. The combined results of both the developer and investor surveys are presented in Table 1.
| Ranking | Risk |
| 1 | Insufficient transmission capacity |
| 2 | Interconnection queue delays and costs |
| 3 | Inflation and input costs |
| 4 | Supply chain constraints |
| 5 | Community opposition |
| 6 | Workforce availability |
Table 1. Biggest Market Risks Facing Investors and Developers, Excluding Tax Credit Uncertainty, by Weighted Average
For most respondents, modifications to the energy tax credits stood above all other risks. When the prospect of policy changes to the energy tax credits was removed, 90% of investors reported anticipating no change or an increase to their risk profiles (Figure 28). Among developers surveyed, 80% of respondents estimated no change or an increase to their risk profiles (Figure 29).
In written responses, both developers and investors also raised the impacts that other policy changes could have on their portfolios. In particular, uncertainty from administrative and regulatory changes create a significant amount of uncertainty for businesses, and new tariffs would impact clean energy input costs and supply chains.
Sponsors are going to start having to think about how much capital they can put at risk for developing assets that take four or five years to develop, if we don’t have some level of certainty around how we’re going to manage the tax credits.
-Institutional investor
Risk Profiles Remain Unchanged for Most Investors, Excluding Policy Uncertainty
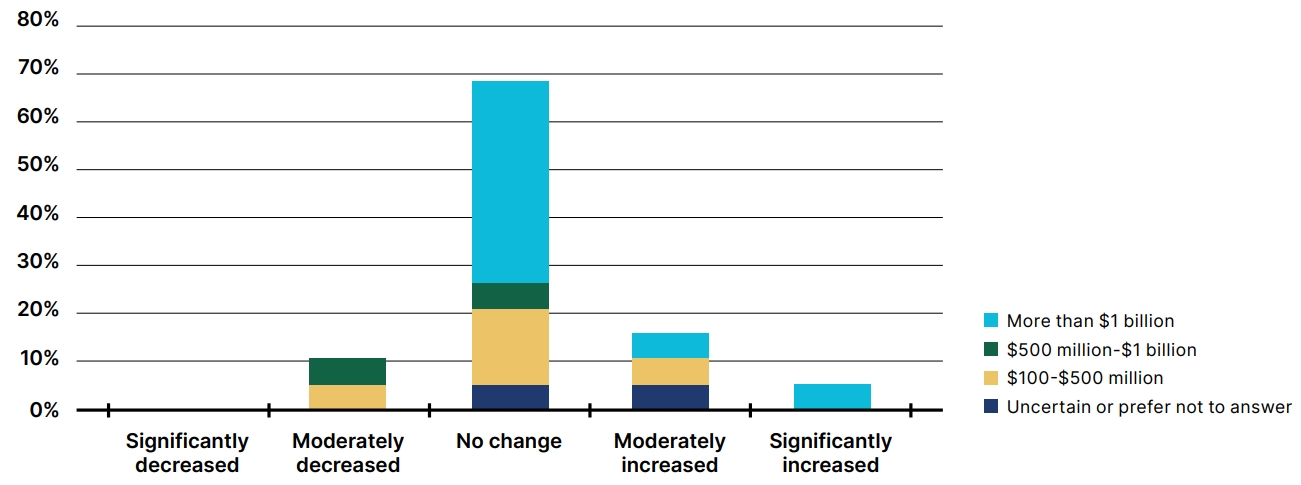
Figure 28. Change in Investor Risk Profiles in 2025 Compared to 2024, Assuming No Policy Modifications to the Energy Tax Credits, by Annual U.S. Sector Investment
Risk Profiles to Remain Unchanged or Moderately Increase for Most Developers, Excluding Policy Uncertainty
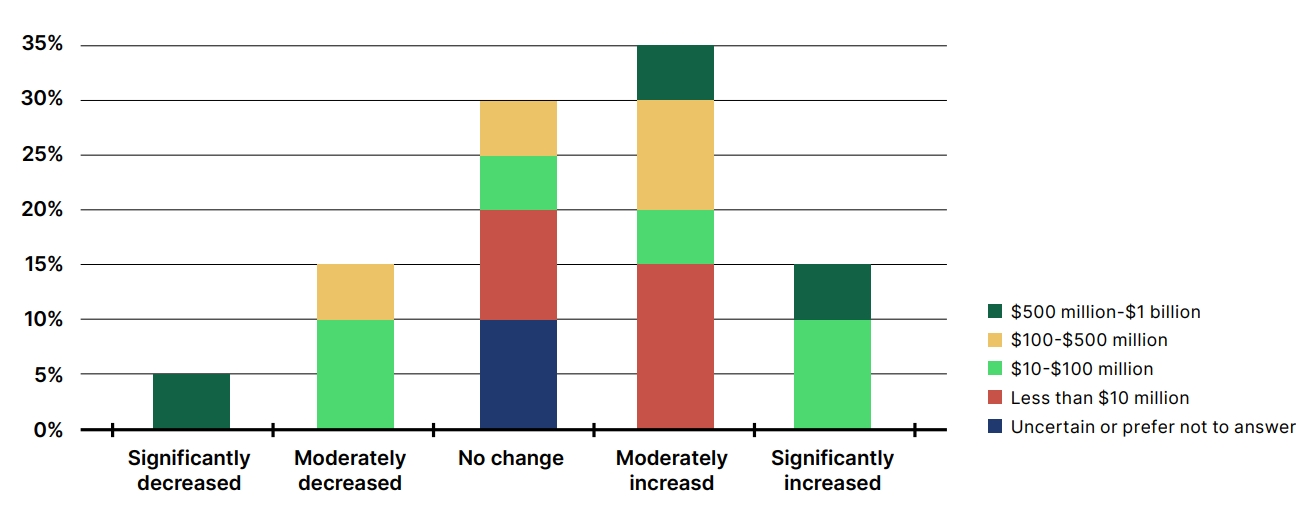
Figure 29. Change in Developer Risk Profiles in 2025 Compared to 2024, Assuming No Policy Modifications to the Energy Tax Credits, by Total Revenue of U.S. Clean Energy Business
When asked specifically about the prospect of tax credit uncertainty, 84% of investors and 73% of developers reported that they would expect to decrease their activity. Among companies with over $1 billion in investments, 80% responded they would significantly or moderately decrease their clean energy investment plans, potentially translating to the loss of tens of billions of dollars in investment.
In interviews, investors and developers conveyed the importance of policy certainty around energy tax credits and transferability. Several interviewees discussed the runway that project financing needs and said that repealing tax credits would have a chilling effect on investments. Respondents’ concerns extended to changes to technology-neutral and other tax credits, the bonus credits, and transferability and direct pay. Significant curtailment or modification of the existing tax credit regime could significantly impact project economics.
With a repeal of the clean energy tax credits there would be a material decrease in the amount of projects getting done. This translates to fewer jobs and lower property tax revenues for the counties where these projects would be built. Landowners would lose the lease revenues that clean energy projects provide, which helps farmers keep their farms in their family. It would also result in a material increase in electricity rates for retail customers across the board because clean technologies are driving down the cost of energy for end users.
– U.S. clean energy developer
Investment Would Decrease with Uncertainty about the Energy Tax Credits
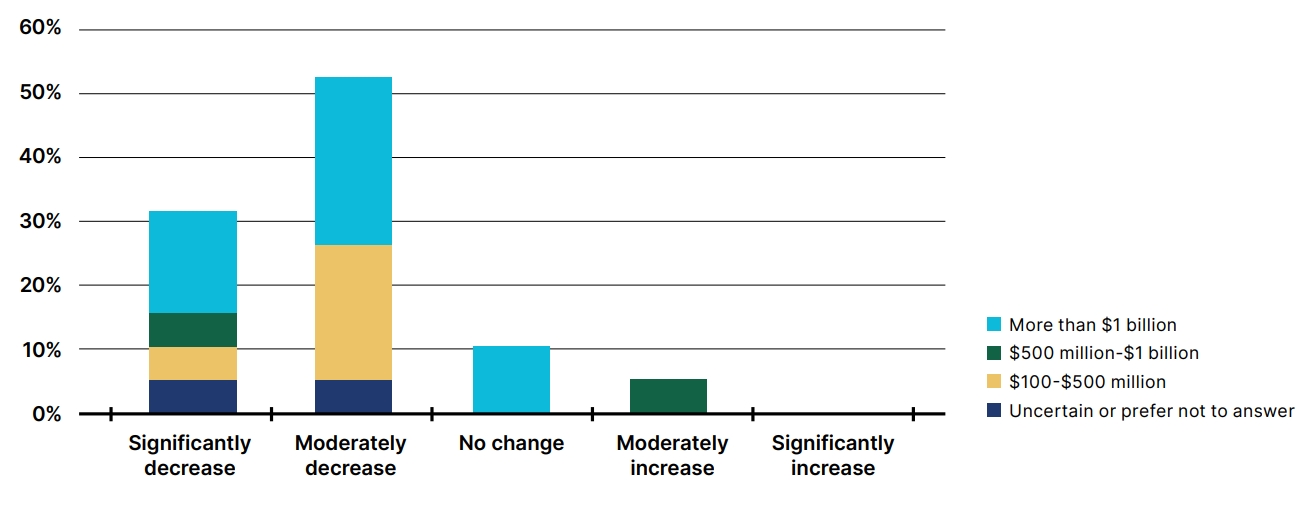
Figure 30. How Investors Anticipate their Clean Energy Investment Plans Would Change with Uncertainty about the Usability of Tax Credits, by Annual U.S. Sector Investment
Most Developers Would Slow Activity with Uncertainty about the Energy Tax Credits
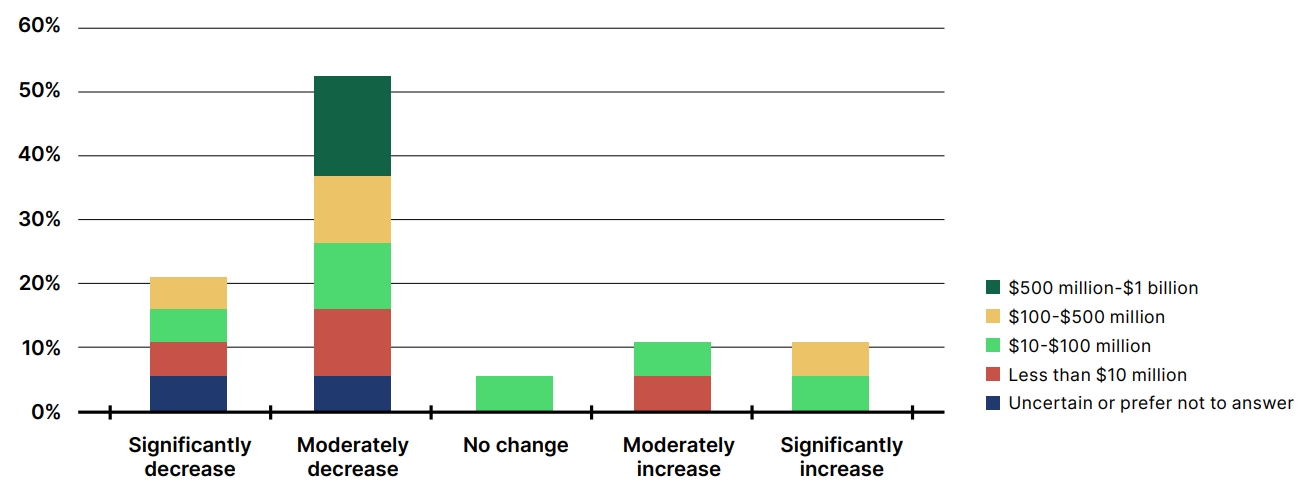
Figure 31. How Developers Anticipate their Clean Energy Development Plans Would Change with Uncertainty about the Usability of Tax Credits, by Total Revenue of U.S. Clean Energy Business
Project Finance Outlook
Developers and investors provided their outlooks for the project financing landscape, also in a scenario with no changes to the tax credits. Notably, just two years after transferability was established as a method for tax credit monetization, it has become a core part of the market, which is evidenced by standalone transferability and hybrid transactions (i.e., tax equity plus transferability) both among the top four sources of financing expected by developers and investors over the next three years.
| Investors | Developers |
| 1 Project-level debt | 1 Standalone transferability |
| 2 Standalone transferability (tied) | 2 Standalone tax equity |
| 2 Hybrid tax equity and transferability (tied) | 3 Project-level debt |
| 4 Cash equity | 4 Hybrid tax equity and transferability |
| 5 M&A | 5 Direct pay |
| 6 Standalone tax equity | 6 M&A |
| 7 Direct pay | 7 Cash equity |
Table 2. Ranking of the Expected Availability of Project Financing Sources in the Market 2025-2027, Assuming No Changes to the Energy Tax Credits
Looking ahead to the rest of 2025, most investors and developers anticipated the availability of hybrid and standalone transferability would moderately or significantly increase relative to 2024.
Investors Expect Transferability to Increase in 2025, Assuming Policy Continuation
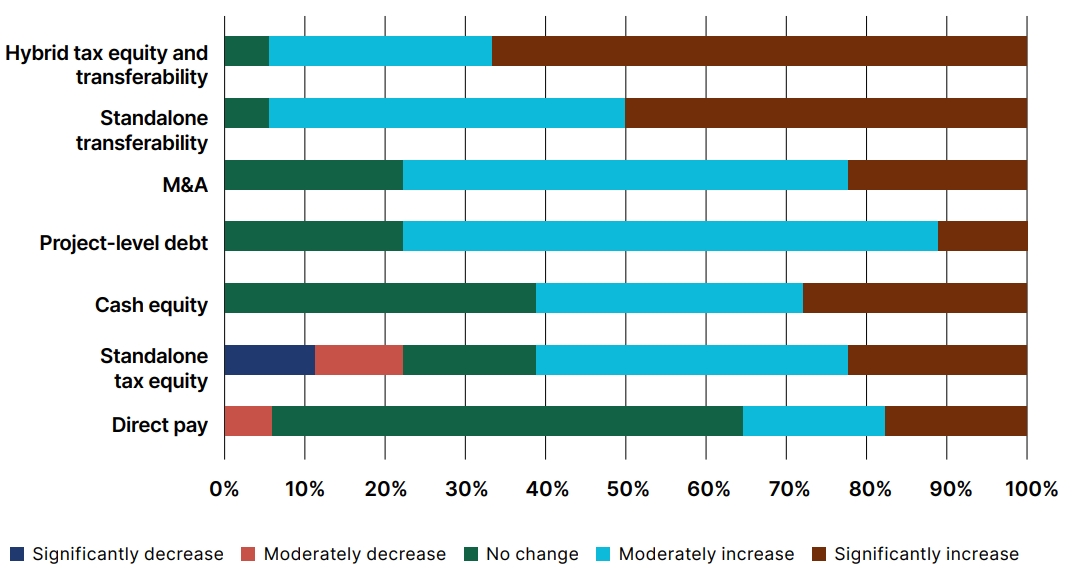
Figure 32. Change in the Availability of Project Finance in 2025 Compared to 2024 Expected by Investors, Assuming No Change to Tax Credits
Most Developers Expect Transferability to Increase in 2025, Assuming Policy Continuation
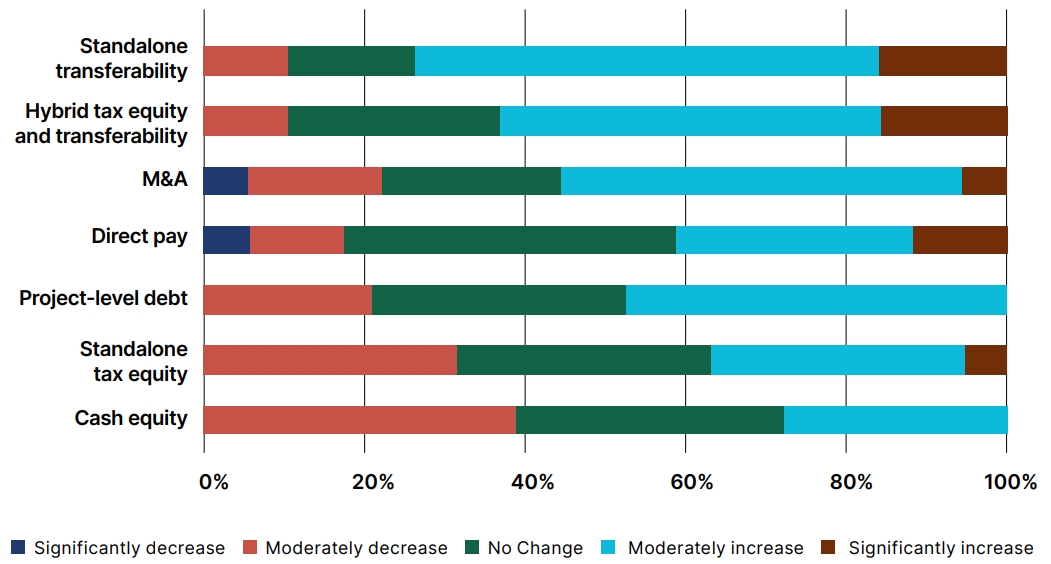
Figure 33. Change in the Availability of Project Finance in 2025 Compared to 2024 for Developers, Assuming No Change to Tax Credits
Three quarters of developers also reported that transferability had a positive impact on their ability to finance projects in 2024.
Transferability Has Had an Impact for Most Developers
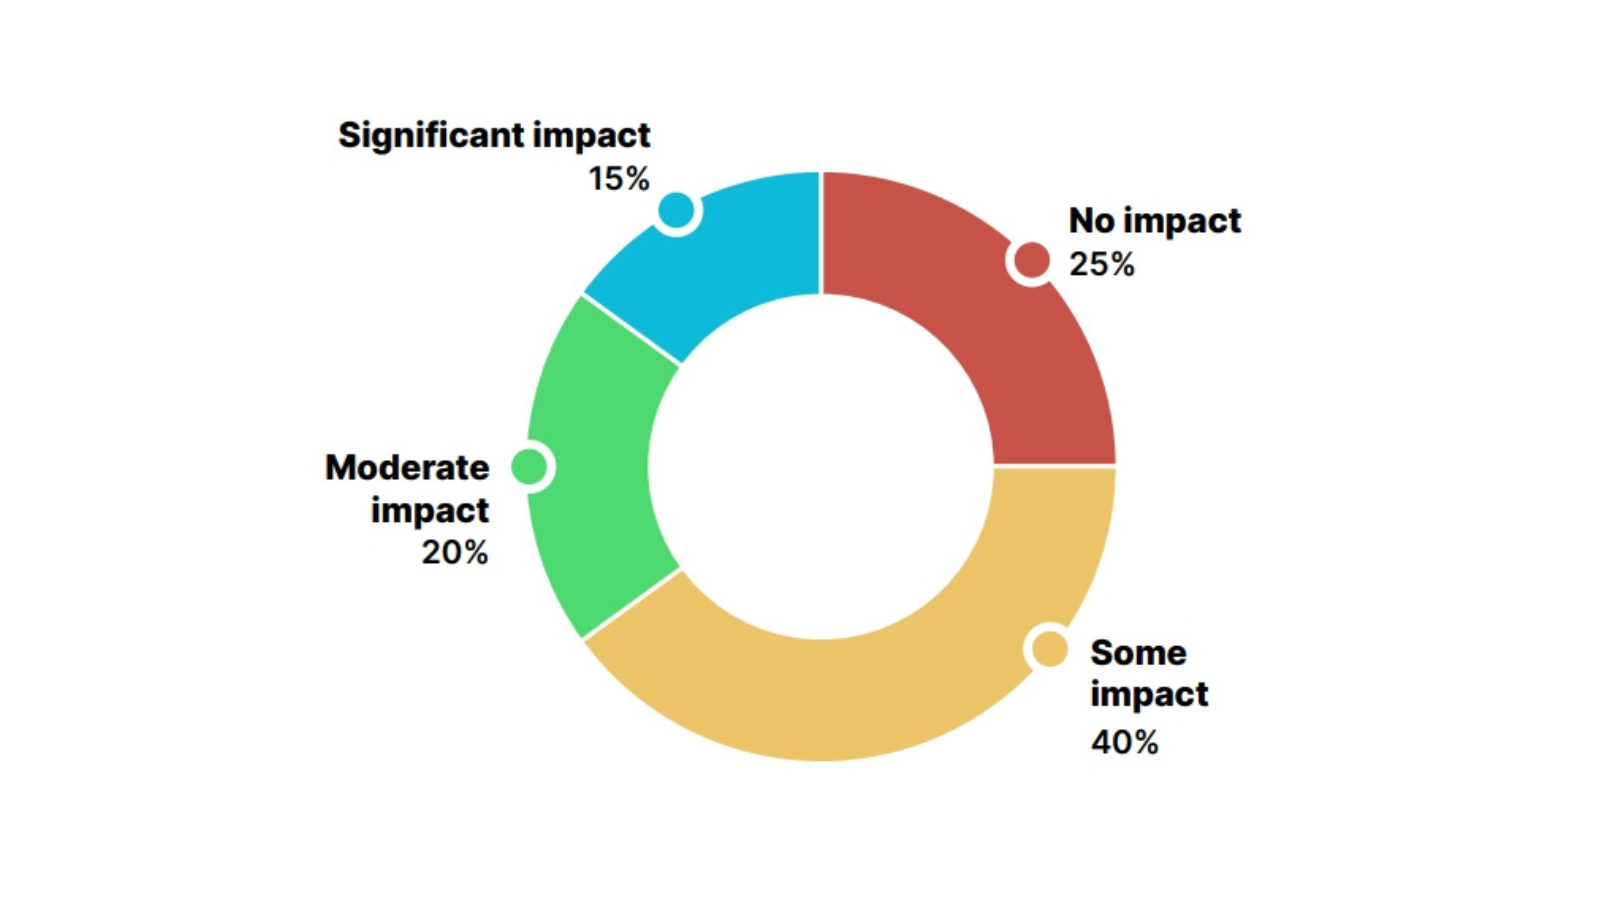
Figure 34. Impact of Transferability on Ability of Developers to Finance Projects in 2024
Transferability has made it a lot easier for corporate America to invest in renewable energy. In the past when you look at traditional tax equity, there was only a handful of players that could really benefit from accessing these tax credits.
–Insurance Broker
Being able to direct transfer credits is about giving access to small and emerging businesses who don’t have access to institutional capital. It also allows smaller more impactful projects to have access to vital capital to bring projects to life. Without transferability, tax equity will go back to just the big players and leave no room for new folks at the table who are necessary to the growth and evolution of the industry.
–Community Solar and Affordable Housing Investment Fund
Transferability opens up the market and accessibility for small-sized firms. The impact is increased competition, lower costs for consumers, new jobs and economic opportunities in communities across the country.
– Community Solar Developer
Another component of clean energy project financing is the ability to secure offtake, as explained by ACORE’s white paper Bridging Demand and Financing: Voluntary Offtake in Clean Energy.66 The importance characterized by this report was echoed strongly by the surveyed market participants. Nearly 90% of respondents characterized offtake agreements as moderately or significantly important in project financing.
Offtake Agreements Are Important to Nearly All Investors
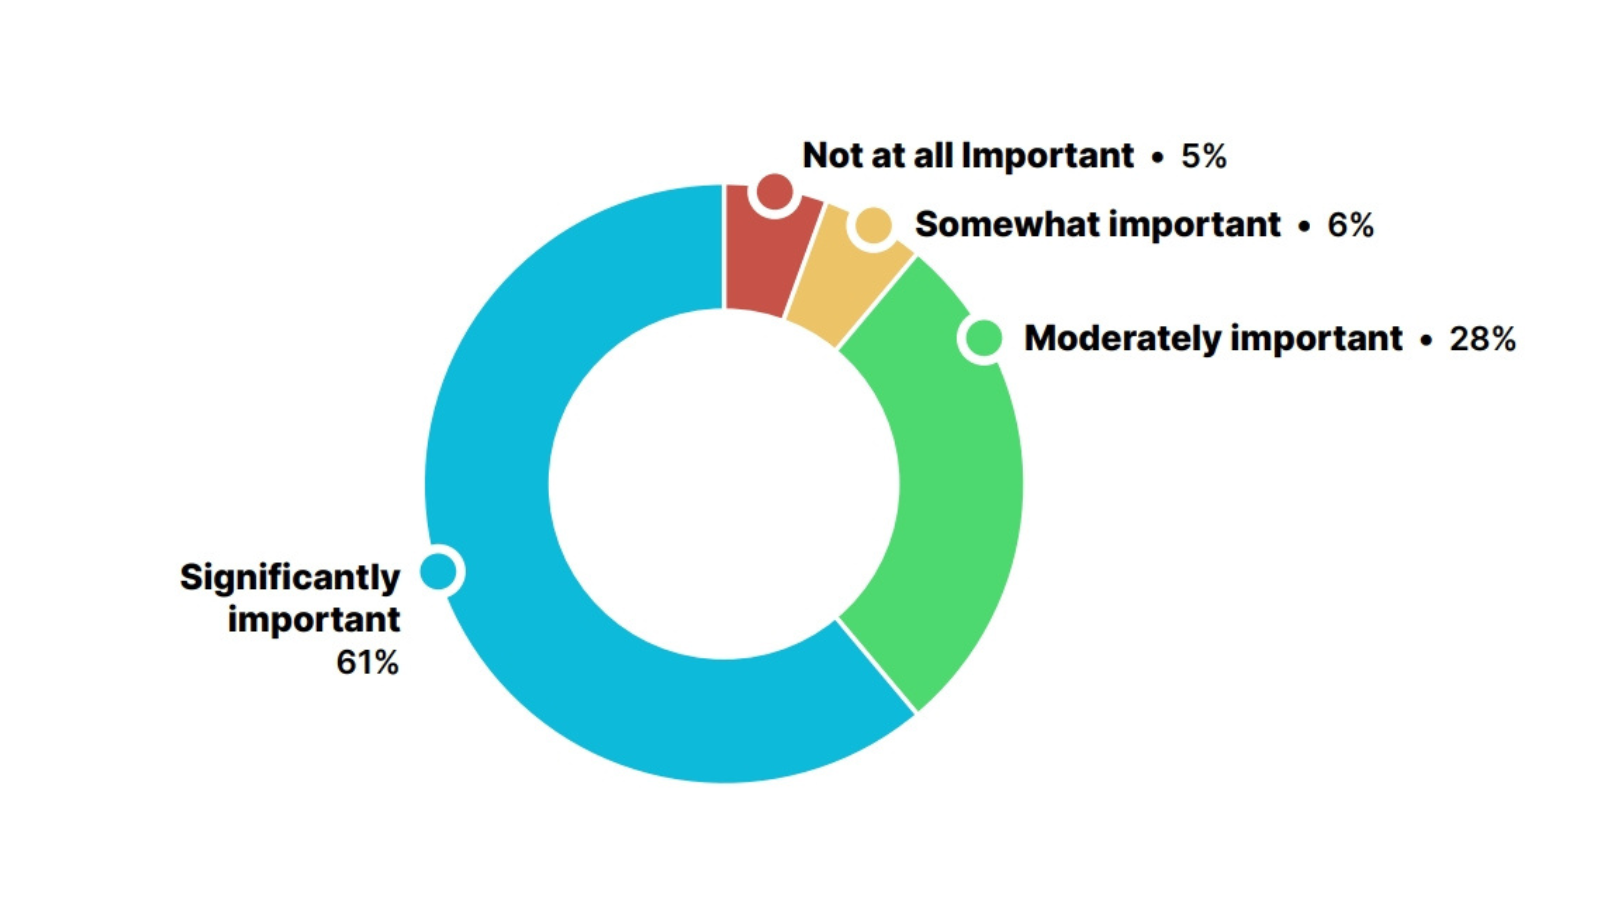
Figure 35. Investor Characterization of Importance of Offtake Agreements in their Financing Considerations
Offtake Agreements Are Important for Developers to Attain Project Financing
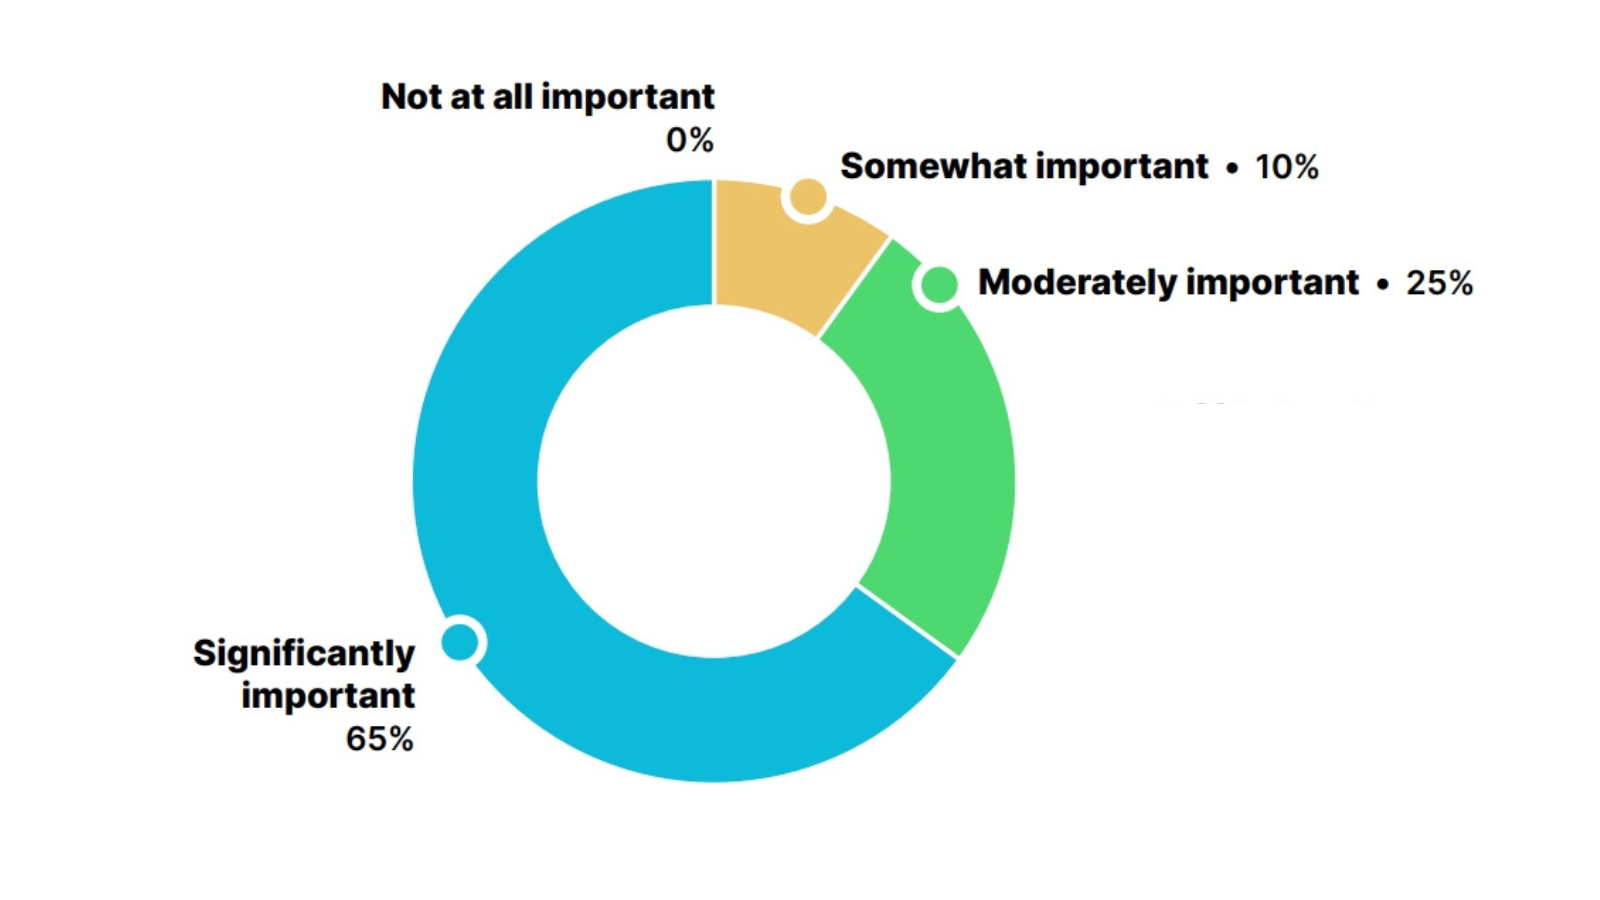
Figure 36. Developer Characterization of Importance of Offtake Agreements in their Ability to Attain Project Financing
Looking at 2025, 40% of developers anticipate that it will be more difficult in 2025 to secure these power purchase agreements (PPAs) than it was in 2024, while 50% anticipate no change in difficulty.
Half of Developers Anticipate No Change to the Difficulty in Securing PPAs in 2025
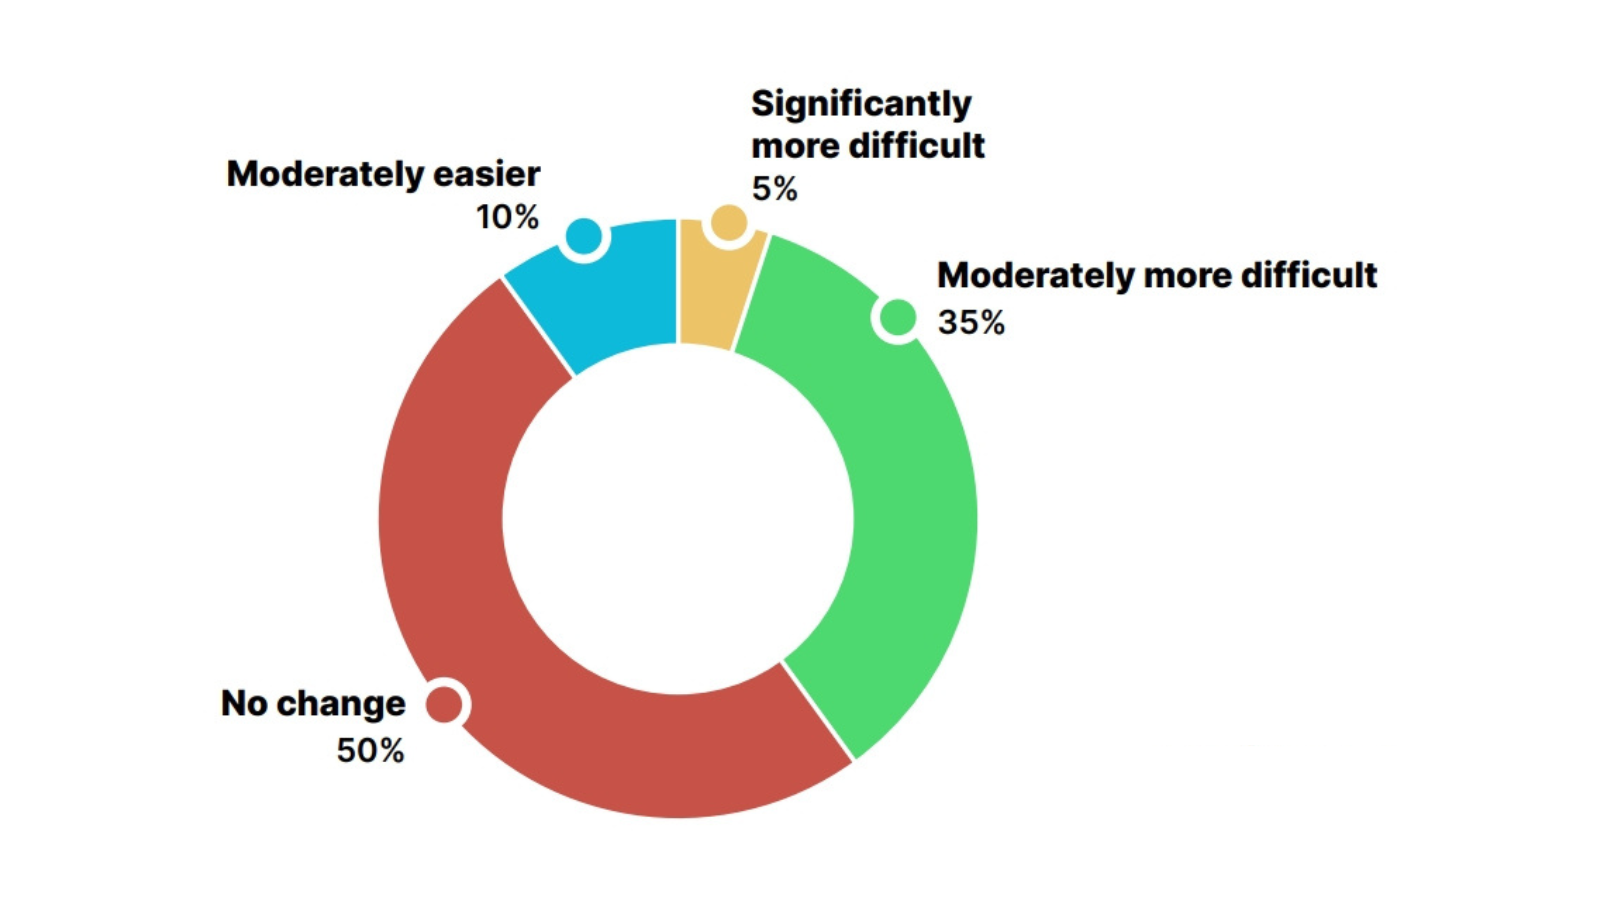
Figure 37. Expected Ability for U.S. Projects to Secure PPAs with Voluntary Offtakers in 2025 Compared to 2024
Asset Classes and Regions
Investors ranked utility-scale solar and energy storage as the two most attractive sectors in clean energy over the next three years.67 For emerging technologies like advanced geothermal, advanced nuclear, CCUS, and clean hydrogen, investors expressed a wider variety of views on their attractiveness, with some investors more bullish than others on how specific technologies will evolve over the next few years.
Both investors and developers ranked PJM, MISO, and ERCOT as the most attractive markets for developing clean energy projects over the next three years.
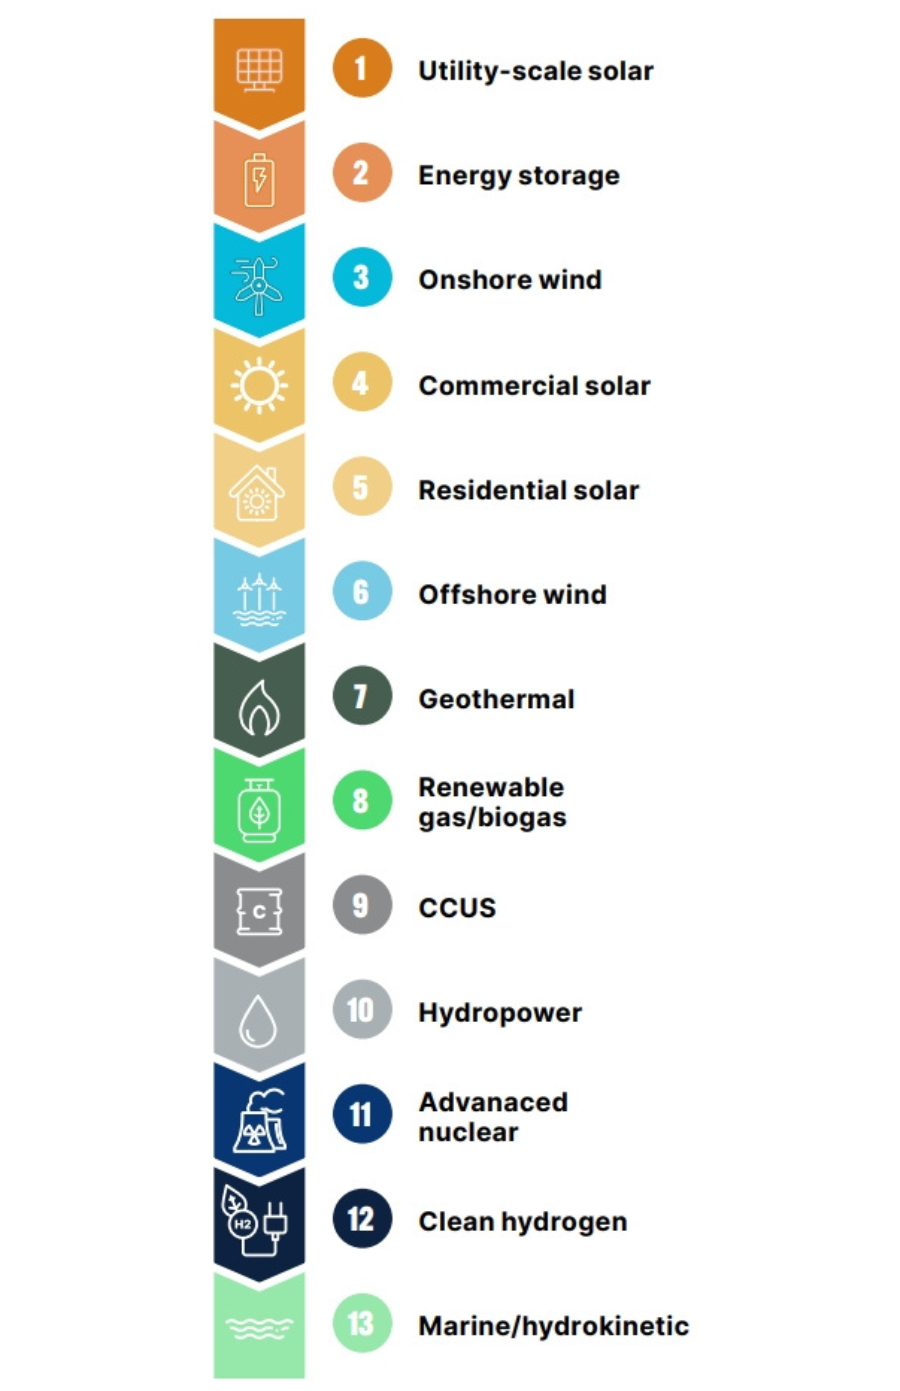
Figure 38. Most Attractive Sectors for Investment Over Next 3 Years, Ranked Average
| Investors | Developers | |
| 1 | MISO | PJM |
| 2 | PJM | ERCOT |
| 3 | ERCOT | MISO |
| 4 | CAISO | Non-RTO West |
| 5 | ISO-NE | CAISO |
| 6 | NYISO | ISO-NE |
| 7 | SPP | NYISO |
| 8 | Non-RTO West | SPP |
| 9 | Non-RTO Southeast | Non-RTO Southeast |
Table 3. Ranking of U.S. Regional Power Markets Most Attractive for Clean Energy Investment or Deployment in 2025-2027
Investors and developers continue to place importance on placing projects in energy communities or low-middle income (LMI) communities. Eighty percent of developers consider developing in these communities to be of at least moderate importance, whereas 67% of investors consider investing in projects in these communities of at least moderate importance in their decision-making.
Locating Clean Energy Projects in Energy Communities or LMI Communities Important to Most Developers and Investors
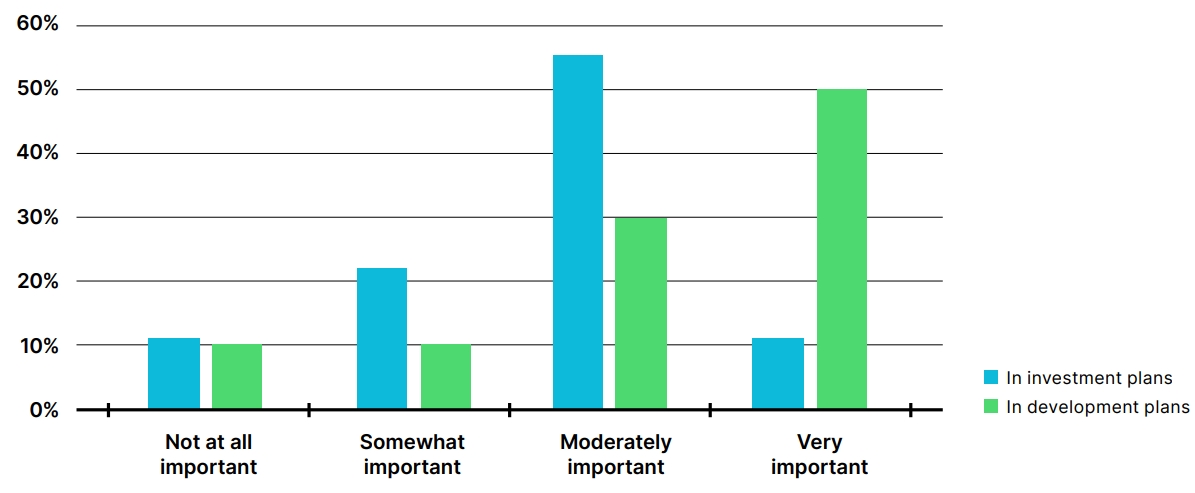
Figure 39. Importance of Locating Clean Energy Projects in Energy Communities or LMI Communities
ConclusionConclusion
The U.S. faces an extraordinary energy challenge and opportunity, with rocketing electricity demand growth and increasing extreme weather events straining the grid to levels not seen in decades. American leadership and innovation across all energy sources — including domestically produced wind, solar, geothermal, hydropower, energy storage, hydrogen, advanced nuclear, and other technologies — can meet this challenge while advancing domestic prosperity.
With record-breaking clean energy investment and deployment in 2024, and historic oil and gas production, the U.S. has the means to dominate across all energy sources. However, as electricity demand continues to grow, there is insufficient capacity to meet all the new load placed on the grid. New energy sources that can come online in the next 12-24 months would alleviate the pressures of this demand, keeping prices from increasing and preventing the proliferation of blackouts. Clean energy can meet this growing demand — and it can do it affordably.
While the U.S. expands natural gas and other domestically available resources, clean energy is already here to meet growing demand, while also providing other benefits to the U.S. economy. Continued growth will add jobs, grow local tax bases, enhance American competitiveness in energy production and energy-intensive sectors, improve grid reliability, power military bases, help extricate critical mineral supply chains from competitors, bring manufacturing back to the United States, and keep power prices affordable for consumers.
Results from ACORE’s market sentiment surveys for investors and developers show that clean energy could draw more investment in 2025 and lead to the deployment of more generation than ever before, but repeal of key energy tax credits and transferability threaten to slow activity. Both large and small companies stressed the importance of long-term certainty for enabling the success of clean energy projects. Market participants cited the critical role of transferability in growing the clean energy sector, with this financing source now a primary source of capital for many projects and supplementing tax equity through hybrid structures.
Based on the survey results and analysis contained throughout this report, the following policy recommendations, if implemented, would achieve universal goals of reducing energy costs, increasing reliability through a diversified and increasing electricity generation mix, promoting investment in U.S. manufacturing and energy project development, and enhancing US competitiveness:
- Maintain key energy tax credits: Without energy tax credits, far fewer projects are likely to come online to meet demand growth needs. Keeping key tax credits will enable the energy sector to add enough capacity to meet demand growth in an affordable manner while spurring innovation in next-generation technologies like enhanced geothermal, advanced nuclear, and CCUS.
- Preserve the transferability provision: Transferability has established a simpler process for energy sector financings, allowing companies across the economy to invest in a broad spectrum of generation technologies and domestic manufacturing facilities. Preserving this provision will enable the continued participation of small and medium-sized businesses in the market and propel more projects from ideas on paper to steel in the ground.
- Provide policy certainty: Providing generation and manufacturing projects with certainty for a multi-year window will allow business and innovation to flourish and enhance U.S. leadership in strategic sectors. Giving businesses the rules of the game will help avoid any slowdowns in energy buildout.
Appendix
Survey Methodology
ACORE conducted two online, anonymous surveys in December 2024 targeting select professionals from companies active in the U.S. clean energy sector that: (1) finance, invest in, or financially advise clean projects, technologies, or companies and (2) actively develop clean energy. Surveyed professionals represent both ACORE member and non-member companies. ACORE compiled the findings of this report via online surveys, interviews, and secondary online research. ACORE contacted over 100 financial institutions and more than 100 development companies, surveying 19 investors and 20 developers. Interview quotes have been lightly edited for clarity.
Profile of Respondents
Investor Survey
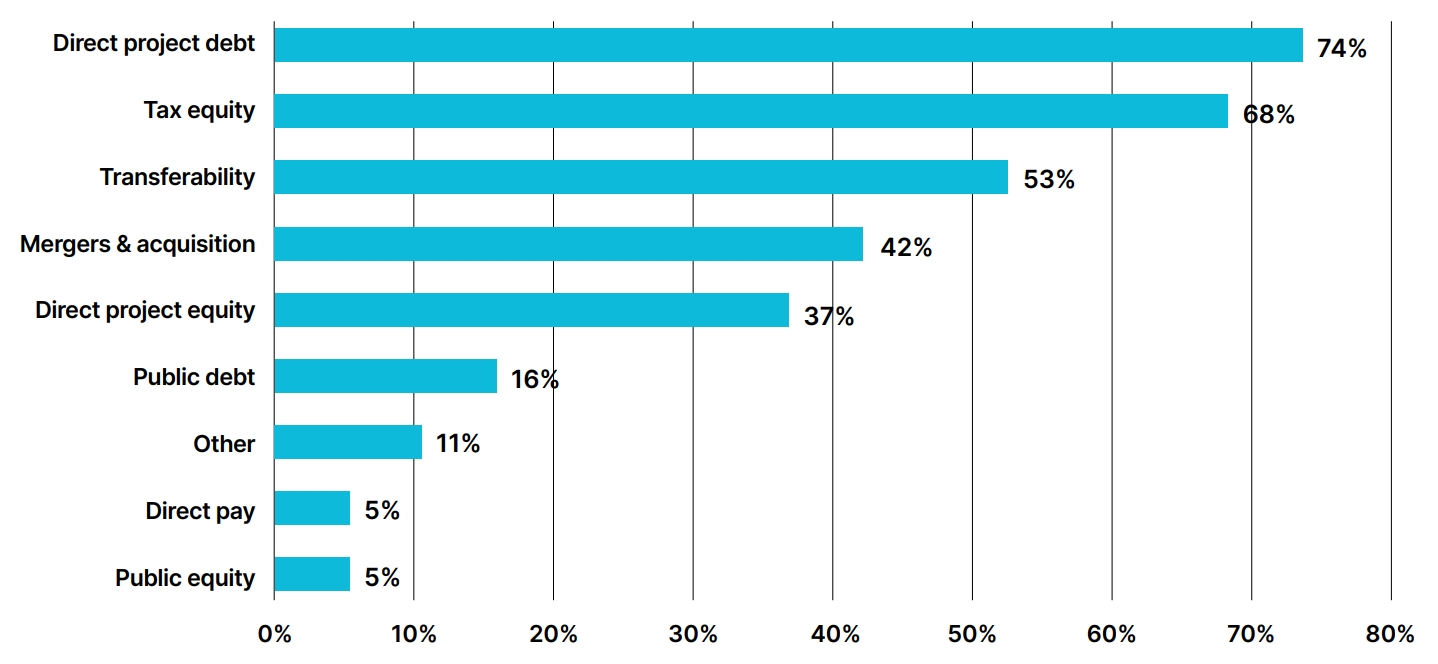
Financing Vehicles Used for Clean Energy
Developer Survey
Authors

ACORE Team Member

ACORE Team Member
Endnotes
1 U.S. Energy Information Administration, “Preliminary Monthly Electric Generator Inventory (based on Form EIA-860M as a supplement to Form EIA-860),” January 24, 2025, https://www.eia.gov/electricity/data/eia860m/.
2 BloombergNEF, “Energy Transition Investment,” last updated February 5, 2025, https://www.bnef.com/interactive-datasets/2d5d59acd9000005. Technologies include renewables, nuclear, energy storage, hydrogen, and carbon capture and storage.
3 U.S. Department of Energy, 2024 U.S. Energy & Employment Jobs Report (USEER), August 28, 2024, https://www.energy.gov/policy/us-energy-employment-jobs-report-useer.
4 Calculated with generation data from BloombergNEF and the Business Council for Sustainable Energy, Sustainable Energy in America 2025 Factbook: Tracking Market & Policy Trends, February 20, 2025, https://bcse.org/market-trends/2025-factbook-download/ and average 2022 residential electricity use from U.S. Energy Information Administration, “Frequently Asked Questions (FAQs): How much electricity does an American home use?” accessed February 11, 2025, https://www.eia.gov/tools/faqs/faq.php?id=97&t=3.
5 ICF, Economy-wide Impacts of the Inflation Reduction Act Energy Provisions, December 19, 2024, https://cleanpower.org/resources/economy-wide-benefits-of-energy-tax-credits/.
6 ICF, Economy-wide Impacts of the Inflation Reduction Act Energy Provisions.
7 Asthin Massie and Aaron Schwartz, “Reality Check: Keeping the Lights on in Extreme Winter Weather,” RMI, December 12, 2023, https://rmi.org/reality-check-keeping-the-lights-on-in-extreme-winter-weather/.
8 Umair Irfan, “The US power grid quietly survived its most brutal summer yet,” Vox, September 28, 2023, https://www.vox.com/climate/23893057/power-electricity-grid-heat-wave-record-blackout-outage-climate.
9 American Clean Power Association, Snapshot of Clan Power in 2024, March 5, 2025, https://cleanpower.org/resources/clean-power-annual-market-report-2024-snapshot/.
10 Molly F. Sherlock, Energy Tax Policy: Historical Perspectives on and Current Status of Energy Tax Expenditures, Congressional Research Service, May 2, 2011, https://sgp.fas.org/crs/misc/R41227.pdf.
11 Brad Stanhope, “Effect of Looming Technology-Neutral ITC, PTC Varies, Depending on Perspective,” Novogradac XV, no. X, October 2024, https://www.lw.com/admin/upload/SiteAttachments/novogradac-jtc-2024-10-RETC-66.pdf.
12 Lesley Hunter, “The Risk Profile of Renewable Energy Tax Equity Investments,” American Council on Renewable Energy, December 1, 2023, https://acore.org/resources/the-risk-profile-of-renewable-energy-tax-equity-investments/.
13 Internal Revenue Service, “Elective pay and transferability,” accessed January 9, 2025, https://www.irs.gov/credits-deductions/elective-pay-and-transferability.
14 Hayden S. Baker, Jeffrey Davis, and Nadav C. Klugman, “Clean Energy Tax Credits – Transferability and Deal Structure Alternatives,” White & Case, May 20, 2024, https://www.whitecase.com/insight-our-thinking/clean-energy-tax-credits-transferability-and-deal-structure-alternatives.
15 Crux, 2024 Transferable Tax Credit Market Intelligence Report, February 10, 2025, https://www.cruxclimate.com/2024-market-report.
16 U.S. Department of Energy, 2024 U.S. Energy & Employment Jobs Report (USEER).
17 U.S. Bureau of Labor Statistics, “Occupational Outlook Handbook: Fastest Growing Occupations,” last modified August 29, 2024, https://www.bls.gov/ooh/fastest-growing.htm.
18 Climate Power, The State of the Clean Energy Boom, January 14, 2025, https://climatepower.us/clean-energy-boom-report/.
19 Energy Innovation, How Repealing the Inflation Reduction Act Would Harm the Economy, December 17, 2024, https://energyinnovation.org/report/how-repealing-the-inflation-reduction-act-would-harm-the-economy/.
20 Eric J. Brunner and David J. Schwegman, “Commercial wind energy installations and local economic development: Evidence from U.S. counties,” Energy Policy 165, April 16, 2022, https://www.sciencedirect.com/science/article/pii/S030142152200218X.
21 ICF, Economy-wide Impacts of the Inflation Reduction Act Energy Provisions.
22 Samson Solar Energy Center, “Empowering our community with clean energy,” accessed February 11, 2025, https://samsonsolarenergycenter.com/community-impact.
23 BloombergNEF, “Energy Transition Investment,” accessed February 8, 2025, https://www.bnef.com/interactive-datasets/2d5d59acd9000005.
24 Bentley Allan and Tim Sahay, Trump’s proposed clean energy retreat: US costs and global rewards, Net Zero Industrial Policy Lab, November 6, 2024, https://www.netzeropolicylab.com/trump-retreat.
25 Arman Shehabi, et. al., 2024 United States Data Center Energy Usage Report, Lawrence Berkeley National Laboratory, December 2024, https://eta.lbl.gov/publications/2024-lbnl-data-center-energy-usage-report.
26 Wilson, Zimmerman, and Gramlich, Strategic Industries Surging: Driving US Power Demand.
27 John D. Wilson and Zach Zimmerman, The Era of Flat Power Demand is Over, Grid Strategies, December 2023, https://gridstrategiesllc.com/wp-content/uploads/2023/12/National-Load-Growth-Report-2023.pdf.
28 Aurora Energy Research, Impact of reform to clean energy tax credits on investment, jobs and consumer bills, January 6, 2025, https://auroraer. com/media/reform-to-clean-energy-tax-credits/.
29 NextEra Energy, “Fourth Quarter and Full-Year 2024 NextEra Energy, Inc. Conference Call,” January 24, 2025, https://www.investor.nexteraenergy.com/news-and-events/events-and-presentations/2025/1-24-25.
30 EIA, “Preliminary Monthly Electric Generator Inventory.”
31 Lawrence Berkeley National Laboratory, “Generation, Storage, and Hybrid Capacity in Interconnection Queues,” accessed January 16, 2025, https://emp.lbl.gov/generation-storage-and-hybrid-capacity.
32 U.S. Department of Energy, Pathways to Commercial Liftoff: Next-Generation Geothermal Power, March 2024, https://liftoff.energy.gov/next-generation-geothermal-power/.
33 Sightline Climate, Climate Tech Investment Trends 2024, January 2025, https://www.sightlineclimate.com/request-report?report-id=2024_investment_report.
34 U.S. DOE, Pathways to Commercial Liftoff: Next-Generation Geothermal Power.
35 Michael Johnson and Ben Ratner, “Powering investments in emerging geothermal technologies,” J.P. Morgan, November 26, 2024, https://www.jpmorgan.com/insights/banking/investment-banking/powering-geothermal-energy-investment.
37 https://www.cruxclimate.com/insights/irs-final-guidance-for-tech-neutral-tax-credits
38 Jin Zhao, Fangxing Li, and Qiwei Zhang, “Impacts of renewable energy resources on the weather vulnerability of power systems,” Nature Energy 9, 1411, https://www.nature.com/articles/s41560-024-01652-1.
39 Gabe Grosberg, David N. Bodek, John Iten, Paul J Dyson, Daria Babitsch, Shiny A Rony, and Daniela Fame, “A Storm Is Brewing: Extreme Weather Events Pressure North American Utilities’ Credit Quality,” S&P Global, November 9, 2023, https://www.spglobal.com/ratings/en/research/
articles/231109-a-storm-is-brewing-extreme-weather-events-pressure-north-american-utilities-credit-quality-12892106.
40 PJM, Winter Storm Elliott: Event Analysis and Recommendation Report, July 17, 2023, https://insidelines.pjm.com/pjm-releases-winter-storm-elliott-report/.
41 American Clean Power Association, Renewable Energy Makes the Grid More Reliable, September 2022, https://cleanpower.org/resources/gridreliability/.
42 Brandt Vermillion, “ERCOT’s Ancillary Services: a beginner’s guide,” December 5, 2024, https://modoenergy.com/research/ercot-ancillary-services-explainer.
43 Aurora Energy Research, Role of Battery Energy Storage Systems (BESS) in the ERCOT market, May 23, 2024, https://auroraer.com/media/new-report-from-aurora-energy-research-finds-that-battery-storage-facilities-saved-texas-grid-over-750-million-during-peak-demand-days-in-winter-2024/.
44 Dede Subakti, California ISO, “Managing the July 2024 heat wave with our partners in California and the West,” https://www.caiso.com/about/news/energy-matters-blog/managing-the-july-2024-heat-wave-with-our-partners-in-california-and-the-west.
45 American Council on Renewable Energy, The Role of Renewable Energy in National Security, October 16, 2018, https://acore.org/resources/the-role-of-renewable-energy-in-national-security/.
46 David S. Eady, Steven B. Siegel, R. Steven Bell, and Scott H. Dicke, Sustain the Mission Project: Casualty Factors for Fuel and Water Resupply Convoys, Army Environmental Policy Institute, September 17, 2009, https://apps.dtic.mil/sti/citations/ADB356341.
47 J.E. Jack Surash, P.E., SES, M.SAME, and Robert Hughes, M.SAME, “Developing Microgrids to Deliver Energy Resilience,” U.S. Army, April 12, 2022, https://www.army.mil/article/255597/developing_microgrids_to_deliver_energy_resilience.
48 Environmental Security Technology Certification Program (ESTCP), Energy Security for Military Installations through Optimized Integration of Large-Scale Energy Storage into Microgrids, January 25, 2020, https://apps.dtic.mil/sti/citations/AD1135031.
49 U.S. Senate, The Select Committee on the Strategic Competition between the United States and the Chinese Communist Party, Critical Minerals Policy Working Group Final Report: Creating Resilient Critical Mineral Supply Chains, December 11, 2024, https://selectcommitteeontheccp.house.gov/media/policy-recommendations/critical-minerals-policy-working-group-final-report.
50 Ibid.
51 EVelution Energy, “Press Release: Evelution Energy Receives $200 Million LOI from U.S. Exim Bank to Fund Construction of U.S. Cobalt Processing Facility,” December 2, 2024, https://evelutionenergy.com/press-release-evelution-energy-receives-200-million-loi-from-u-s-exim-bank-to-fund-construction-of-u-s-cobalt-processing-facility/.
52 Solar Energy Industries Association, “American Solar Manufacturing Is Back, and It’s Big.”
53 American Clean Power Association, Clean Energy Investing in America.
54 Solar Energy Industries Association, “Solar & Storage Supply Chain Dashboard,” last updated February 2025, https://seia.org/research-resources/solar-storage-supply-chain-dashboard/.
55 Wood Mackenzie and Solar Energy Industries Association, Solar Market Insight Report: Q4 2024, December 4, 2024, https://seia.org/research-resources/us-solar-market-insight/.
56 Solar Energy Industries Association, “United States Surpasses 50 GW of Solar Module Manufacturing Capacity.
57 Luke Bassett, “Anchoring Clean Energy Manufacturing Investments in Coal Country and Beyond,” U.S. Department of the Treasury, May 16, 2024, https://home.treasury.gov/news/featured-stories/anchoring-clean-energy-manufacturing-investments-in-coal-country-and-beyond.
58 Alfred Johnson, “Transferable tax credits are boosting S.C. and U.S. economies; here’s how,” Greenville News, May 26, 2024, https://www.greenvilleonline.com/story/opinion/contributors/2024/05/26/how-transferable-tax-credits-are-helping-businesses-grow/73717200007/.
59 Lazard, Levelized Cost of Energy+, June 2024, https://www.lazard.com/research-insights/levelized-cost-of-energyplus/.
60 Brendan Pierpont, Clean Energy Isn’t Driving Power Price Spikes, Energy Innovation, July 9, 2024, https://energyinnovation.org/report/clean-energy-isnt-driving-power-price-spikes/.
61 U.S. Energy Information Administration, “U.S. wholesale electricity prices were lower and less volatile in 2024,” January 16, 2025, https://www.eia.gov/todayinenergy/detail.php?id=64284&utm_medium=email.
62 ICF, Economy-wide Impacts of the Inflation Reduction Act Energy Provisions, December 19, 2024, https://cleanpower.org/resources/economy-wide-benefits-of-energy-tax-credits/.
63 Aurora Energy Research, Impact of reform to clean energy tax credits on investment, jobs and consumer bills.
64 Ibid.
65 ACORE conducted the surveys in December 2024, and the responses do not reflect the impacts of recent administrative actions from the Trump administration on clean energy.
66 Lesley Hunter and Jeffrey Gorham, “Bridging Demand and Financing: Voluntary Offtake in Clean Energy,” American Council on Renewable Energy, December 17, 2024, https://acore.org/resources/bridging-demand-and-financing-voluntary-offtake-in-clean-energy/.
67 These surveys were conducted in December 2024, prior to President Trump’s executive actions affecting on and offshore wind development.
Join leaders from across the clean energy sector.
What will our next 20 years look like? Here’s the truth: they’ll be better with ACORE at the forefront of energy policy.
Shannon Kellogg
Amazon Web Services (AWS)