
- Energy Storage & Decarbonization Pathways
- Grid Infrastructure
- Project Finance
- Renewable Energy Innovation
- Siting & Permitting Reform
- Tax Incentives & Appropriations
- Trade & Supply Chain
- Transmission & Power Markets
- Workforce
- Fact Sheets
The Latest Statistics & Trends on U.S. Clean Energy
American Clean Energy:
It’s Here.
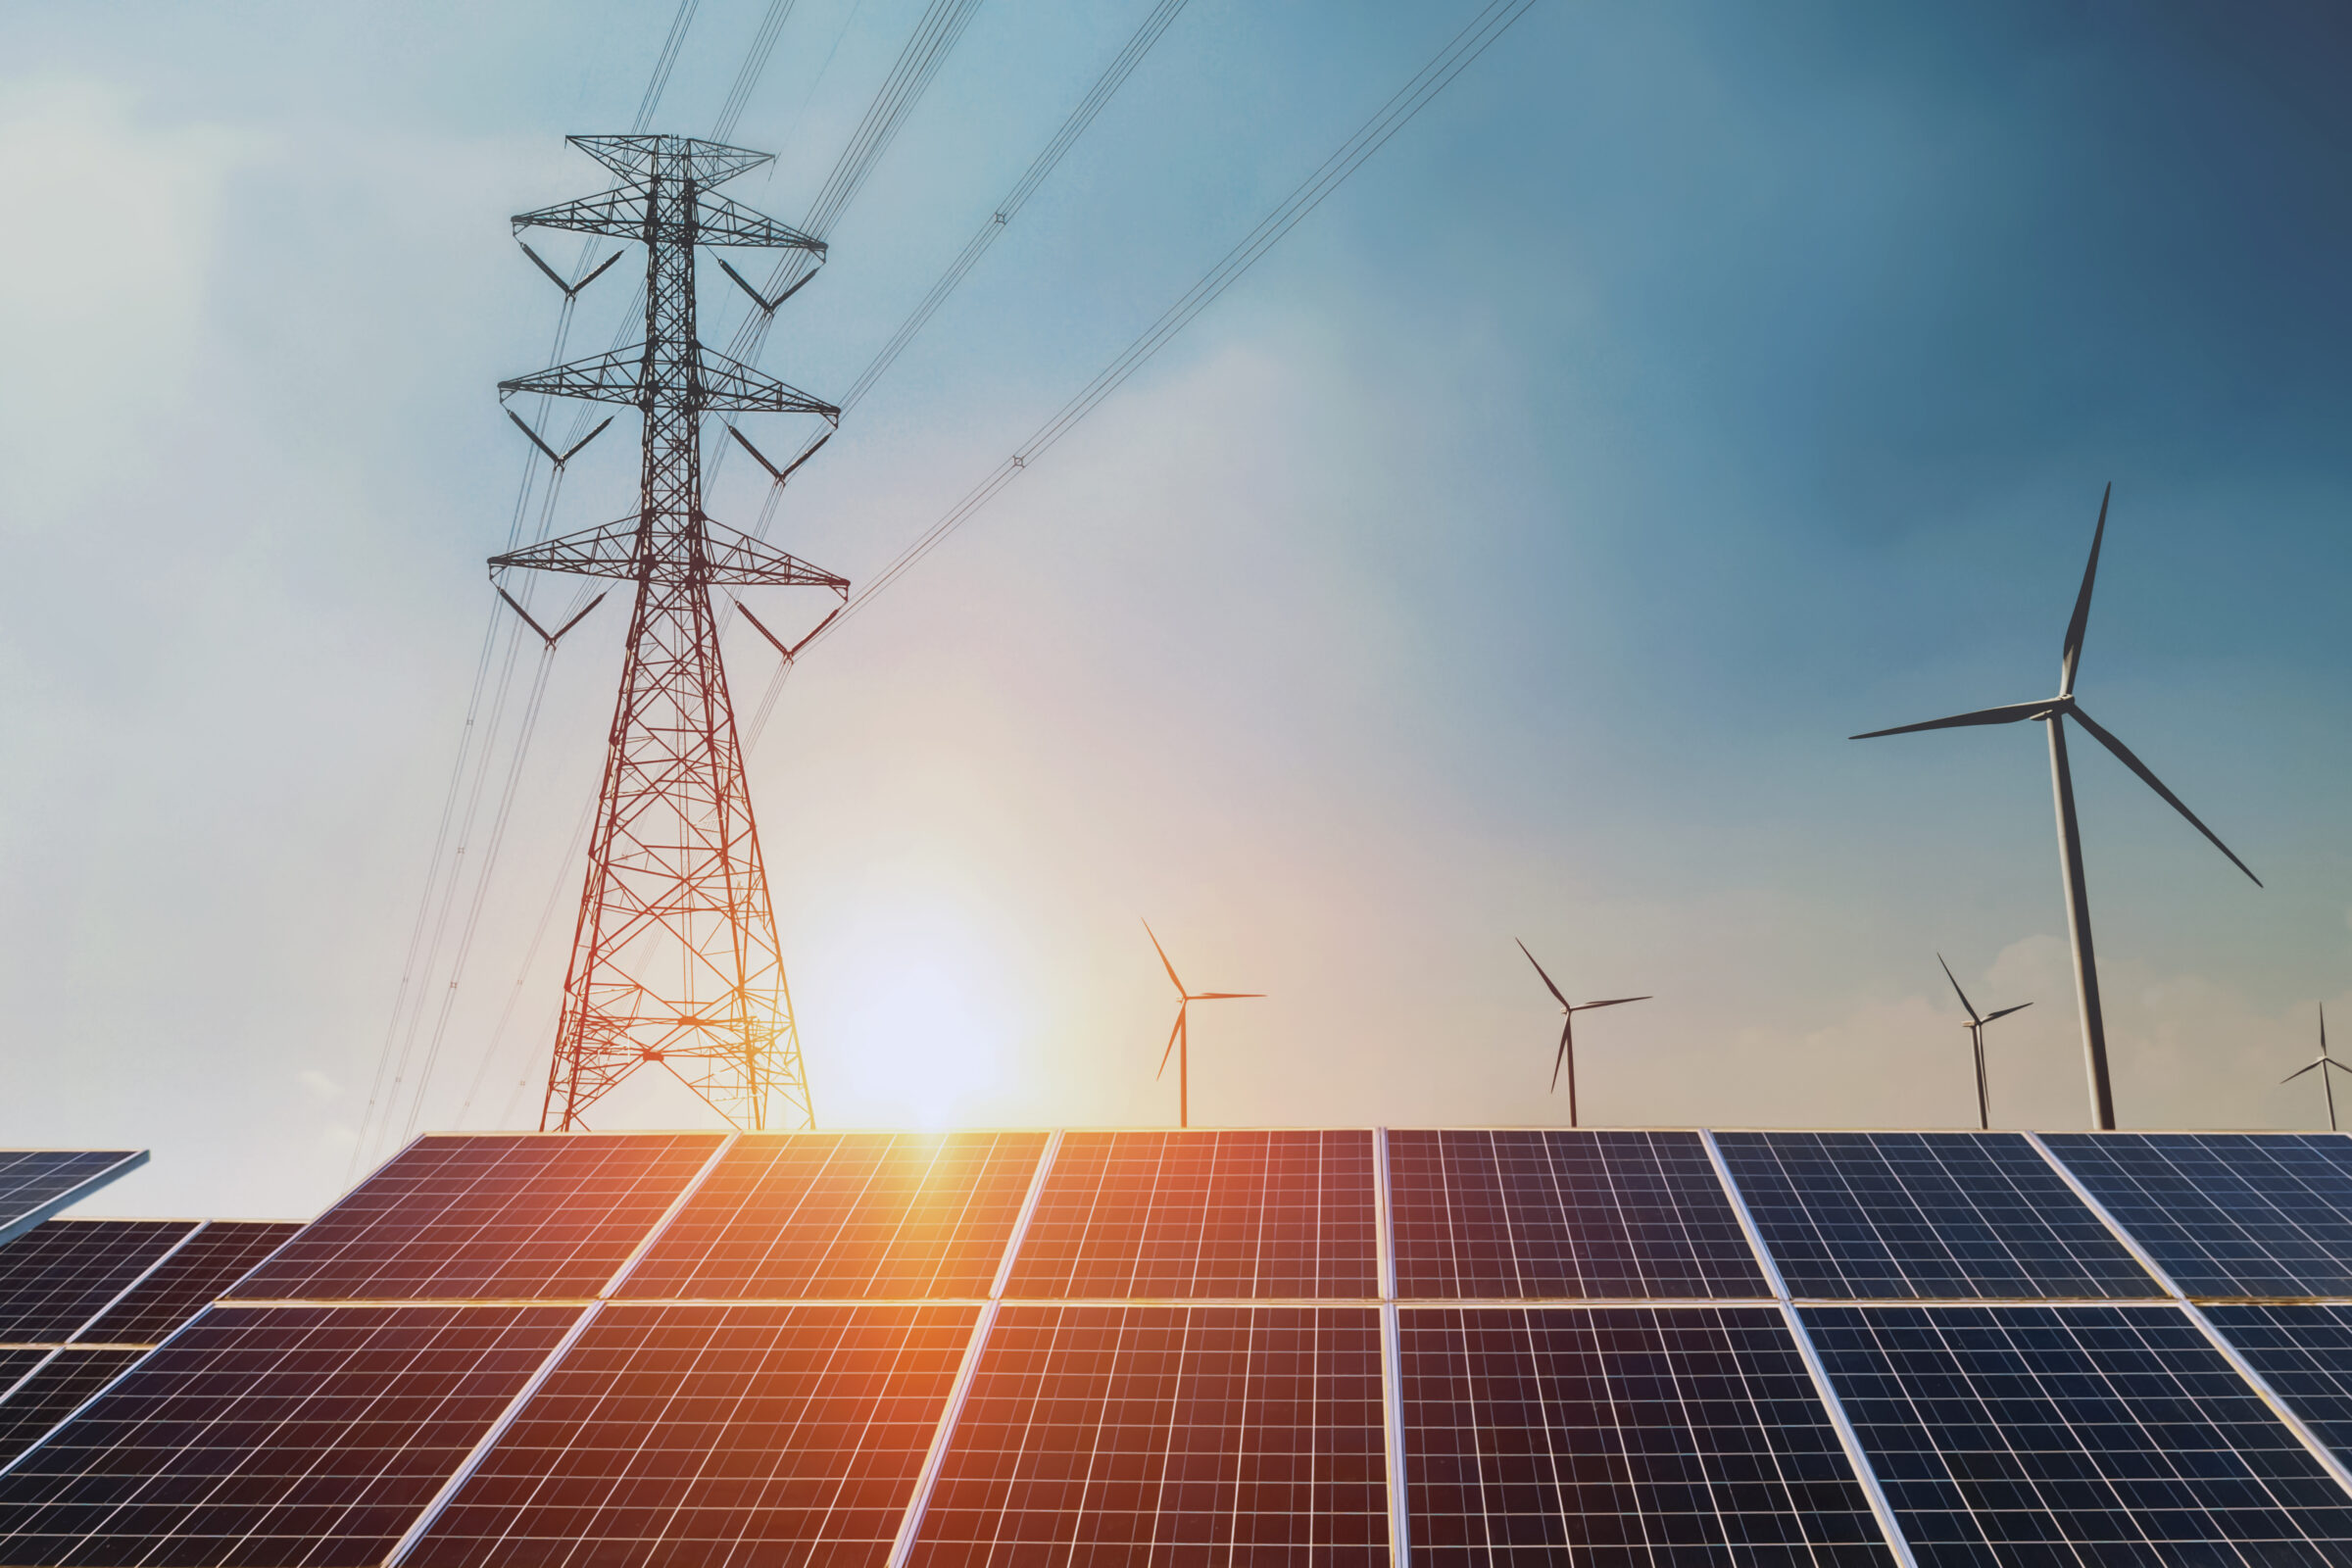
From sea to shining sea, clean energy is powering America. This page provides key information and research on clean energy in the U.S., offering insights into the rapid growth of technologies like wind, solar, storage, nuclear, geothermal, hydropower, and more. Whether you’re a policymaker, journalist, or just curious about America’s energy landscape, these statistics and trends will help you understand how the nation is embracing affordable, reliable, and clean energy.
From over 100 Army installations supporting our service members to more than 6 million students learning in schools with solar panels, clean energy is here and powering every part of American life. (Source: U.S. Army; Generation 180)
AffordabilityAffordability

Clean energy is affordable.
-
$ 282 Clean energy policies save the average U.S. household $235 to $282 per year (Source: Resources for the Future)
-
$ 40 B The U.S. would save $40+ billion a year by building a national high-voltage transmission network (Source: Macro Grid Initiative)
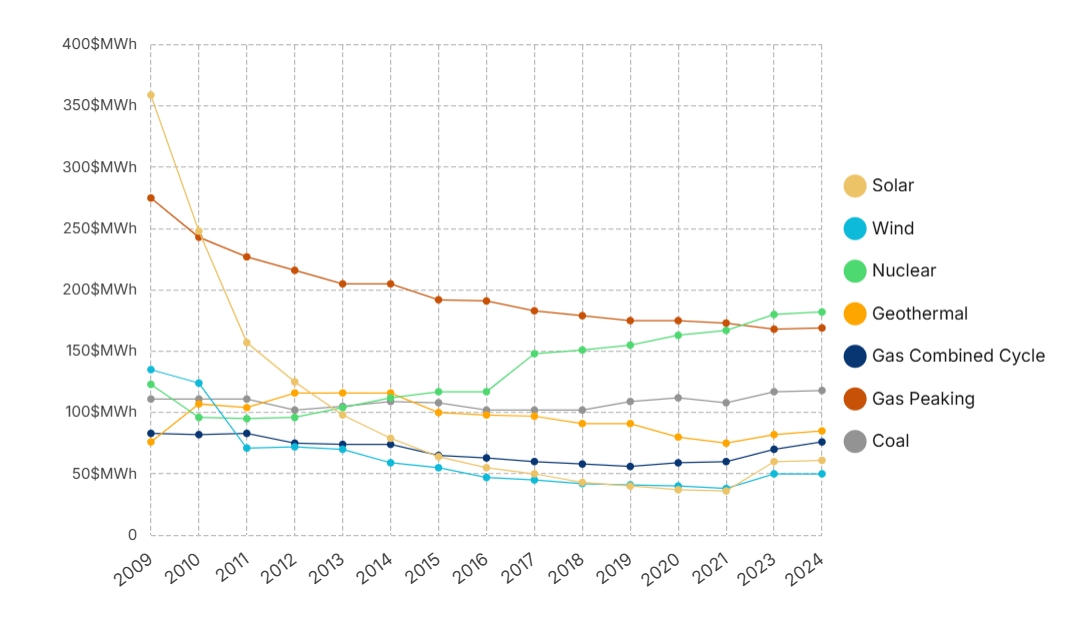
Solar and onshore wind are the cheapest sources of new electricity.
Levelized Cost of U.S. Energy Sources
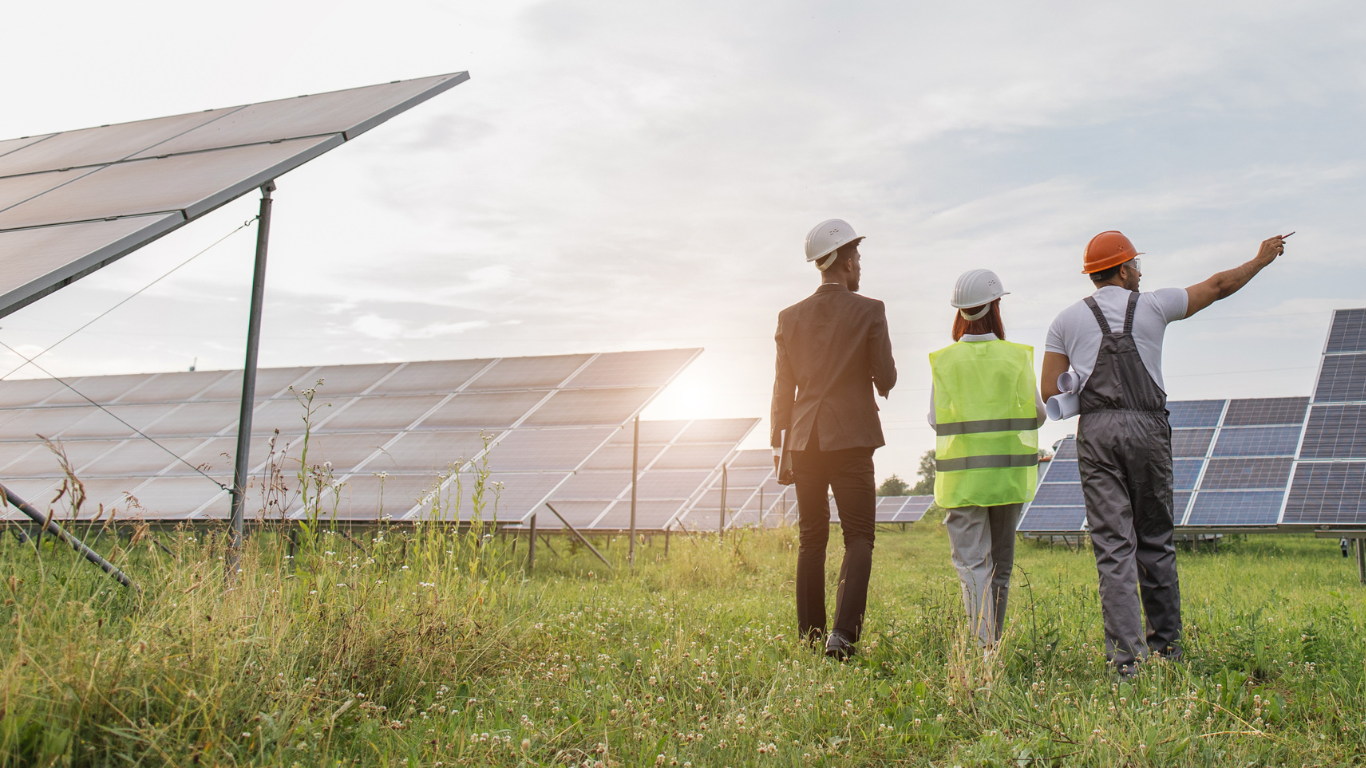
Jobs
Clean energy creates jobs.
-
3500000 There were 3.5 million jobs in the clean energy sector in 2023 (Source: U.S. Department of Energy)
-
100000 100,000+ total new U.S. manufacturing jobs have been announced since 2022, including 33,000 in designated Energy Communities (Source: Clean Economy Tracker)
-
2 X Jobs in clean energy grew more than 2x as fast as jobs in the overall U.S. economy (Source: U.S. Department of Energy)
Wind techs and solar installers are the #1 and #2 fastest-growing jobs in America.
(Source: U.S. Bureau of Labor Statistics)
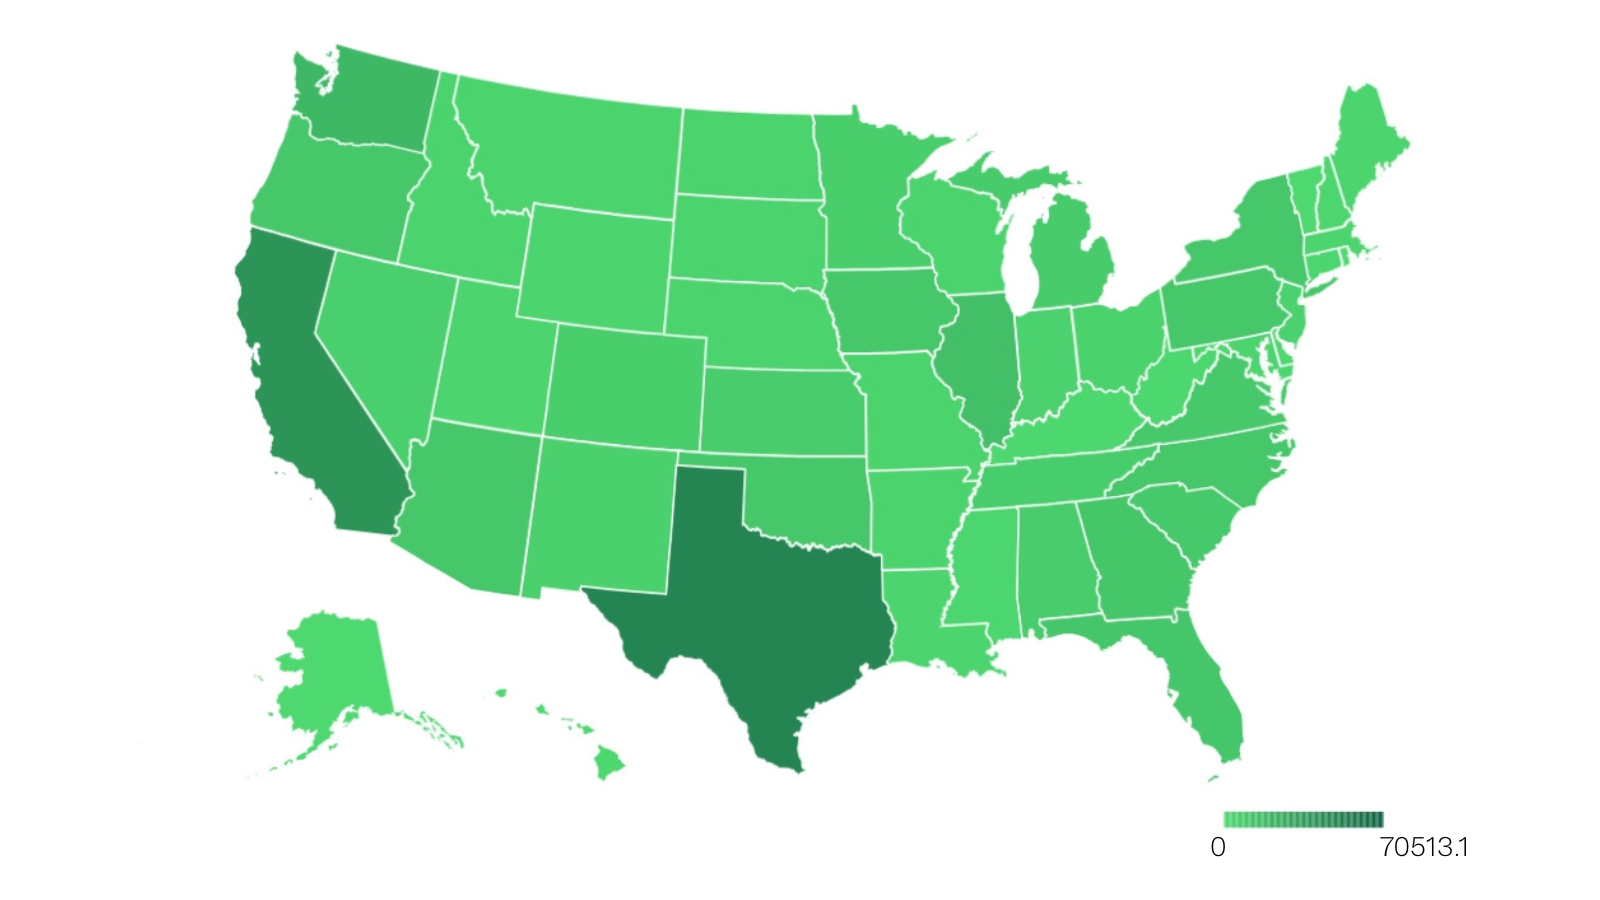
Solar and Wind Jobs by U.S. State
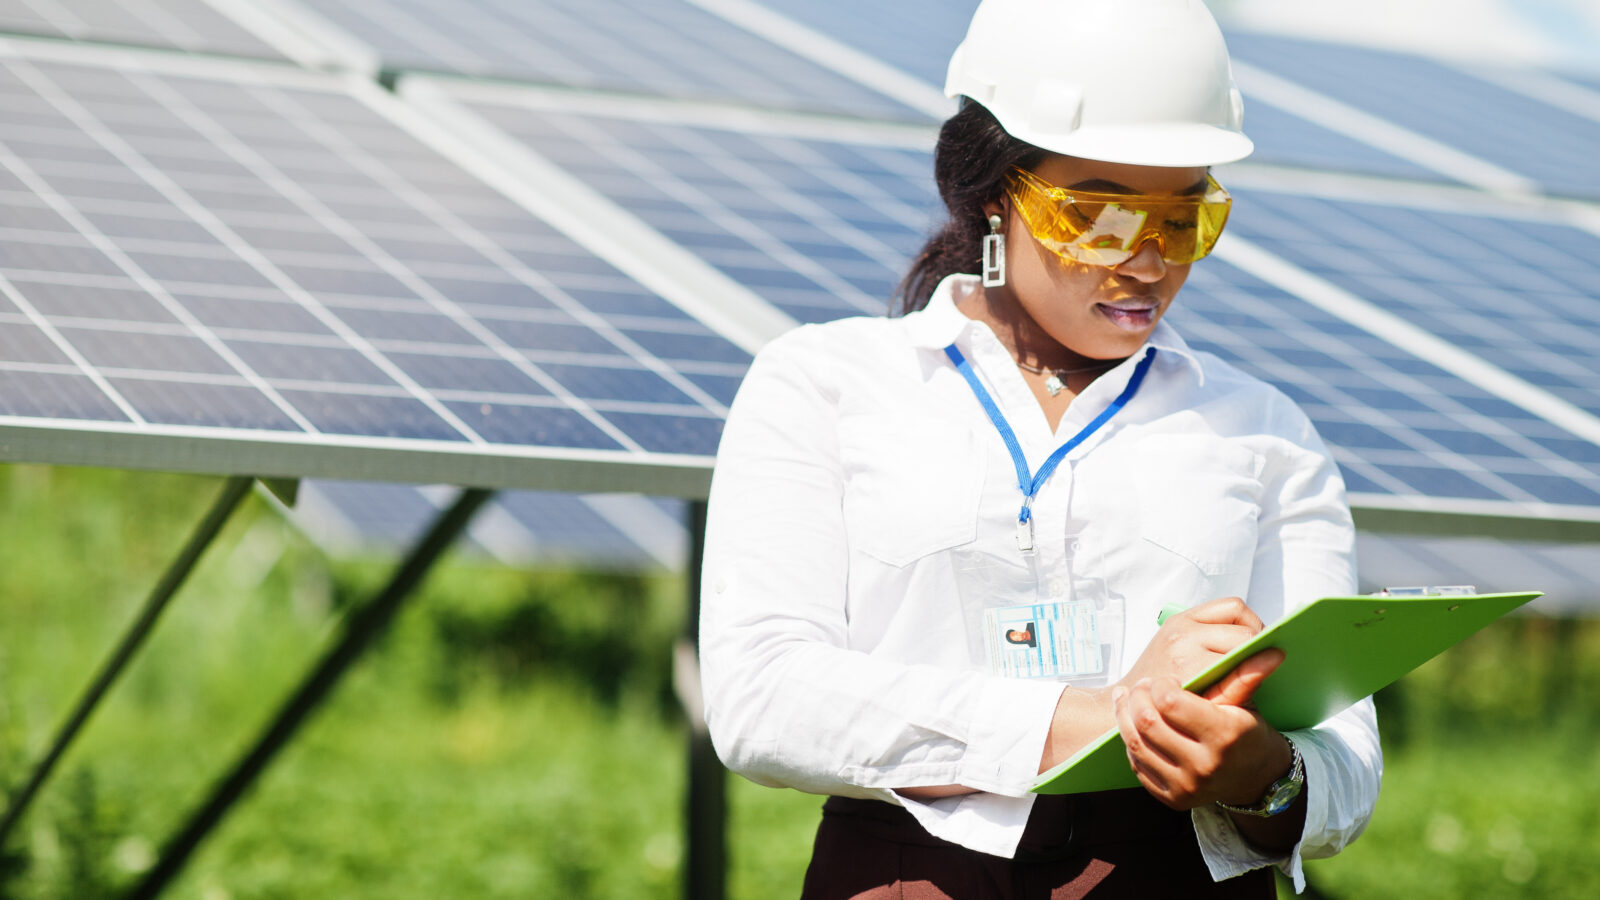
Investment

Clean energy plays a major role in our economy.
-
$ 105 B $105+ billion was invested in U.S. clean energy in 2023, the most in history (Source: BloombergNEF)
-
$ 75 B $75 billion has been invested in clean energy manufacturing projects since 2022 that are now online (Source: American Clean Power Association)
-
46 46 states have seen an announcement for a new clean energy manufacturing project (Source: U.S. Department of Energy)
-
42 42 clean energy manufacturing projects announced are already online and 119 more are currently under development (Source: American Clean Power Association)
78% of all corporate PPAs in U.S. history for clean energy were signed in the last 5 years, representing over 82 GW of corporate procurement.
(Source: BloombergNEF)
Corporate Power Purchase Agreements (PPAs) for Clean Energy in U.S. History
In 2025, the U.S. is expected to make more solar panels than it installs for the first time.
(Source: Clean Energy Associates)
CapacityCapacity
Clean energy capacity is skyrocketing.
-
162 M Clean energy generated enough electricity in 2023 to power 162 million homes (Source: BloombergNEF; U.S. Energy Information Administration )
-
530 Clean energy capacity has reached 530+ GW in the United States (Source: BloombergNEF)
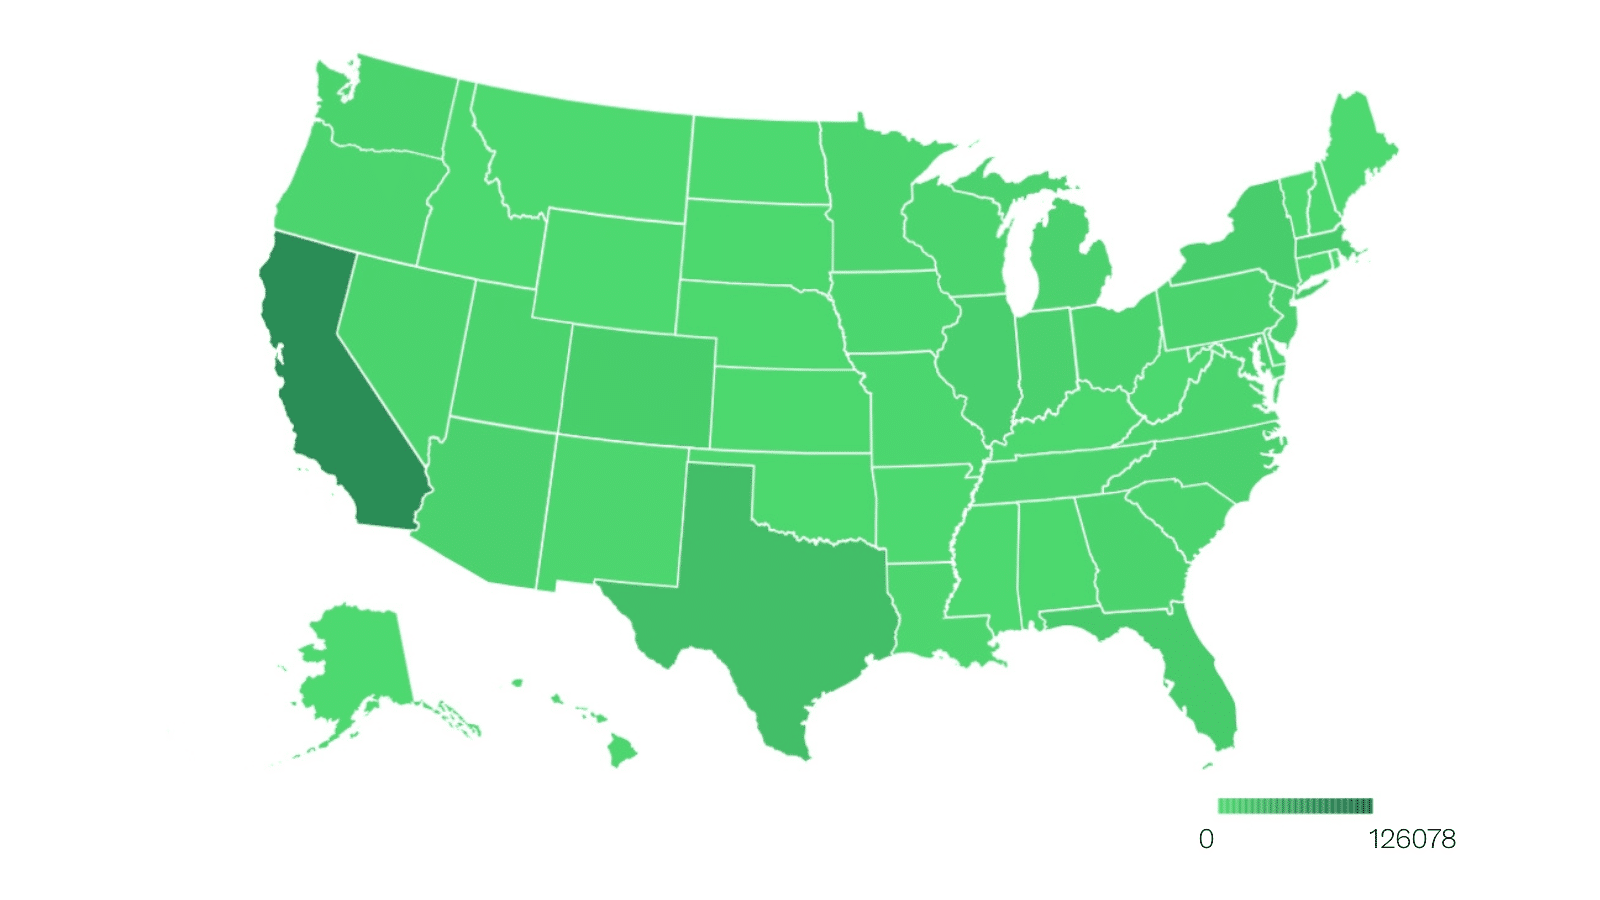
Cumulative Clean Energy Capacity in Megawatts (MW) by U.S. State
It’s important to note that the total numbers are even higher given that capacity from small-scale solar (projects under 1 MW) are not captured.
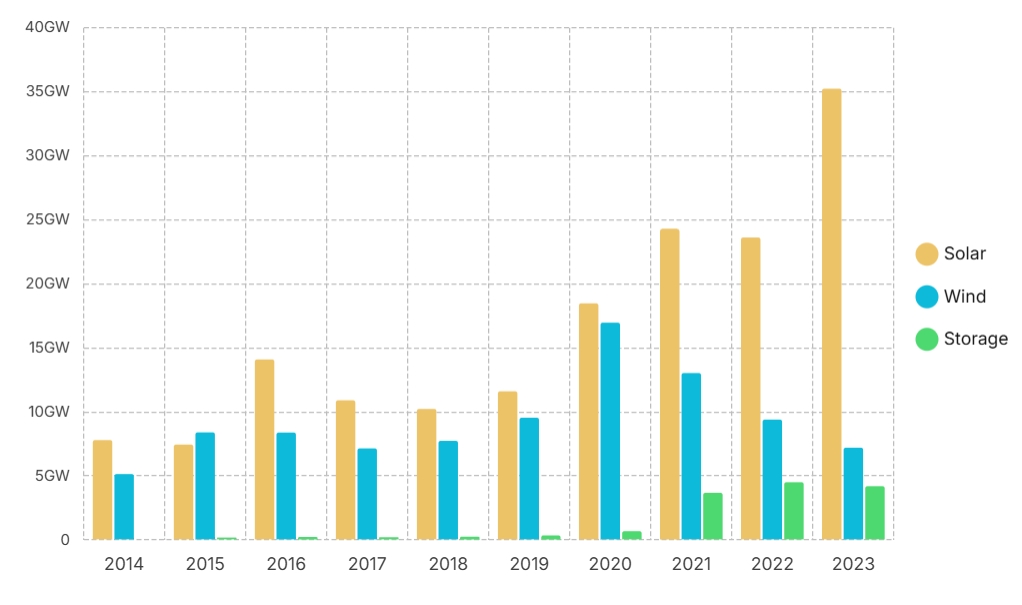
91% of total utility-scale capacity deployed YTD in 2024 comes from solar, wind, and storage projects.
(Source: U.S. Energy Information Administration)
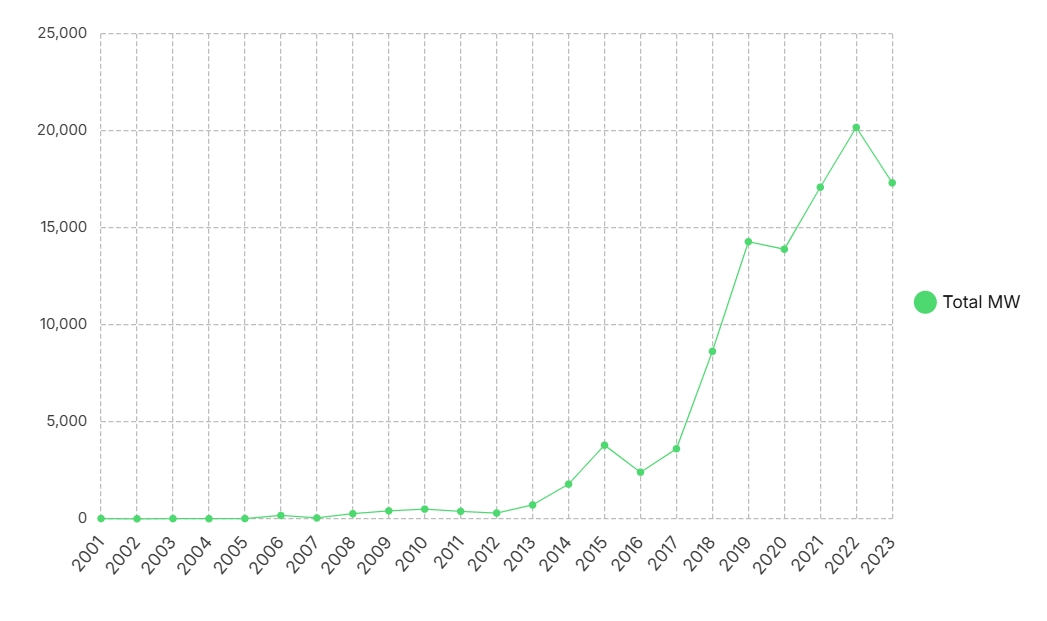
New Annual Deployments of U.S. Solar, Wind, and Storage Capacity Over the Last 10 Years
Sustainability

Clean energy drove a 7% reduction in power sector emissions from 2022-2023.
(Source: Energy Information Administration; Environmental Protection Agency)
This is equivalent to the CO2 emissions from:
-
8 T 7.6 trillion smart phones charged.
-
5 B 5.3 billion propane cylinders used for home barbeques
-
22 M 22.7 million homes’ annual electricity
-
13 B 12.9 billion gallons of gasoline
Join leaders from across the clean energy sector.
What will our next 20 years look like? Here’s the truth: they’ll be better with ACORE at the forefront of energy policy.
Shannon Kellogg
Amazon Web Services (AWS)